Chart Elements
The Chart pane includes the following elements:
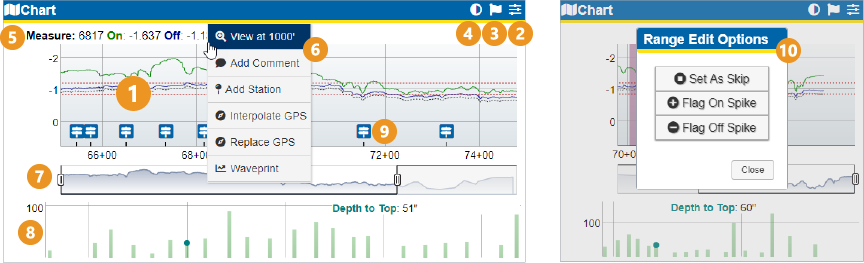
Chart pane with right-click and alt-click menus (left and right images)
-
Chart — Displays current survey data.
-
Chart options — Click
 to open the Chart Options window when viewing CIS, Depol, or DCVG data. Select the General, CIS & Depol, DCVG, DOC, and Icons tabs to customize their respective chart options. For detailed instructions, refer to Customize the Chart Display.
 -
Flag spikes — Click
 to open the Flag Spikes Options window and automatically identify potential spikes or skips. Review the suggestions and manually correct the anomalous data. For detailed instructions, refer to Correct Survey Data.
 -
Splice — Click
 to splice survey segments. For more information about splicing data, refer to Splice Survey Segments.
 -
Legend — To view the measurements related to a point on the chart, move your mouse until it's hovering over the survey data point you are interested in. The legend above the chart displays the various measurement readings for the data point. To customize the data that shows in the legend, refer to Customize the Chart Display.
-
Options menu — Right-click on a data point on the map to zoom in or out to 1000 feet, add a comment to the data point, associate an engineering station with the data point, interpolate or replace the GPS for two points, or attach a waveprint to CIS surveys. For more information about these options, refer to Zoom On Chart Pane and Chart Pane Options Menu.
-
Range Selector — Select and drag range marker
 on either end of the range selector to zoom in or out on the chart. You can also Click and Drag within the range selector to pan to the right or left of the chart. For more ways to zoom in and out on the map, refer to Zoom On Chart Pane.
 -
Depth of Cover — Displays depth of cover, if this option has been enabled. Refer to Chart Options — DOC Tab for more information.
-
Comment icon — To view comments associated with a data point, click the
 icon above the X-axis for the data point you are interested in. A Survey Comments window opens, displaying the comment(s) related to the data point(s) represented by the selected icon.
 -
Range Edit Options (Alt-click menu) — To display the Range Edit Options window, press Alt on the keyboard and click and drag to highlight the region to be flagged. The Range Edit Options window allows you to flag a region as a spike or skip. For detailed instructions, refer to Correct Survey Data.