View Data in the Chart
The Chart pane displays the survey segment's measurement readings in a bar or line chart format, as well as allows you to annotate and edit the survey data. Below the measurement chart is a range selector for an easy method of zooming in and out on sections of data. Depending on available data and selected display options, depth of cover information may show in bar chart format below the range selector.

Chart Pane
Refer to Chart Elements for details about each of the part of the Chart pane.
Customize Chart Display
Click ![]() to open the Chart Options window. Select the General, CIS & Depol, DCVG, DOC, and Icons tabs to customize their respective chart options. For detailed instructions, refer to Customize the Chart Display.
to open the Chart Options window. Select the General, CIS & Depol, DCVG, DOC, and Icons tabs to customize their respective chart options. For detailed instructions, refer to Customize the Chart Display.
View Survey Data
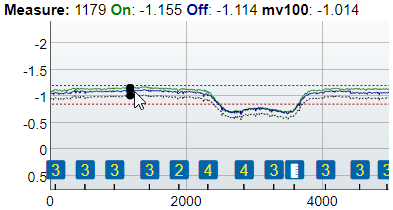
To view the measurements related to a point on the chart, hover your mouse over the survey data point you are interested in. The legend above the chart displays the various measurement readings for the data point. To customize the data that shows in the legend, refer to Customize the Chart Display.

Measurement Readings in the Chart Legend
To view comments associated with a data point, click the Survey Comments icon above the X-axis for the data point you are interested in. A Survey Comments window opens, displaying the comment(s) related to the data point(s) represented by the selected icon.
Zoom In or Out on the Chart
You can zoom in or out to view the data on the chart. Refer to Zoom On Chart Pane for more details.
Clean Up Survey Data
When survey data is modified![]() to refresh the survey and load the updated data in all of the panes. Refer to Correct Survey Data for instructions detailing how to add or edit comments, add engineering stations, setting regions as skips or spikes, interpolating GPS, splicing survey files, and adding waveprints to survey data.
to refresh the survey and load the updated data in all of the panes. Refer to Correct Survey Data for instructions detailing how to add or edit comments, add engineering stations, setting regions as skips or spikes, interpolating GPS, splicing survey files, and adding waveprints to survey data.