View Data in Table
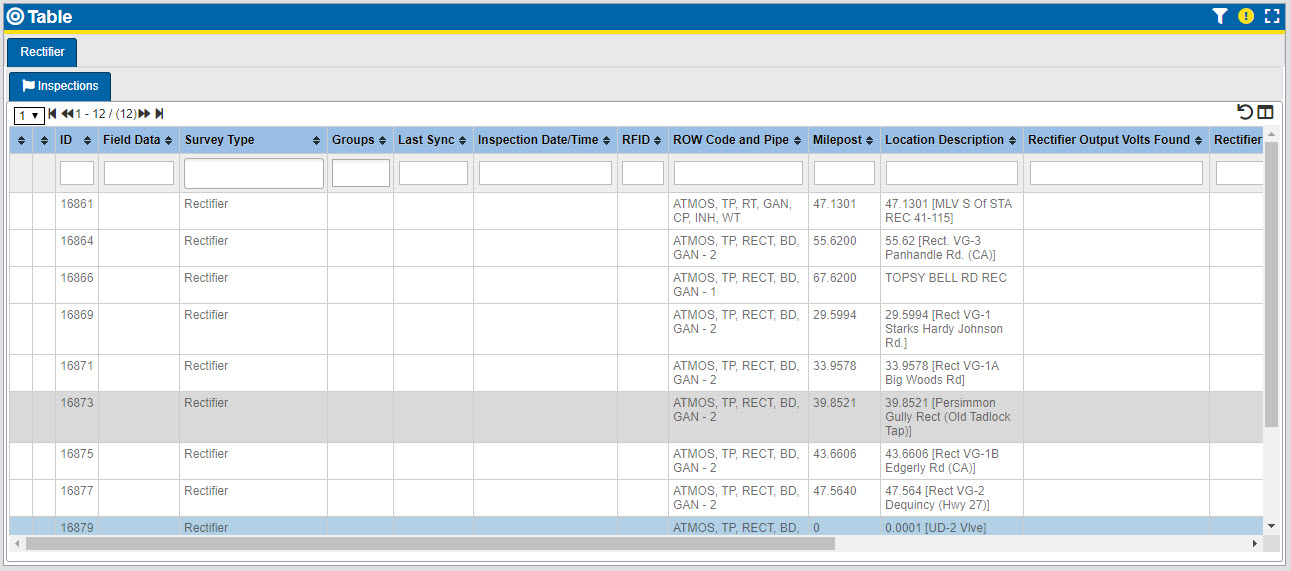
The Table pane displays the selected survey type's data in a standard table format of columns and rows. If there are more than 250 rows worth of survey data, the table will be further divided into pages of data. The columns can be filterable by data or displayed in ascending or descending order.

Table Pane
Navigate Between Pages of Data
Up to 250 rows of survey data can show at a time. If the row of survey data you wish to see is not visible on the table, use the page navigation options to locate the survey data.

Page Navigation Options
Toggle Show Required
Click ![]() in the Table banner to view only the required records. The required records are highlighted in yellow and the icon changes to
in the Table banner to view only the required records. The required records are highlighted in yellow and the icon changes to ![]() . Click the icon again to remove the highlight.
. Click the icon again to remove the highlight.
Toggle Show Required Elements
Click ![]() in the Table banner to view only the required elements. The required elements of the record are highlighted in yellow and the icon changes to
in the Table banner to view only the required elements. The required elements of the record are highlighted in yellow and the icon changes to ![]() . Click the icon again to remove the highlight and filter.
. Click the icon again to remove the highlight and filter.
Toggle Showing Child Rows
Click ![]() in the Table banner to view only child rows. The selected rows are highlighted in yellow and the icon changes to
in the Table banner to view only child rows. The selected rows are highlighted in yellow and the icon changes to ![]() . Click the icon again to remove the highlight and filter.
. Click the icon again to remove the highlight and filter.
Export
Click the ![]() in the Table banner to export the survey data currently displayed in the Table pane. Refer to Export Custom Survey Data for additional information.
in the Table banner to export the survey data currently displayed in the Table pane. Refer to Export Custom Survey Data for additional information.
Filter or Sort Columns
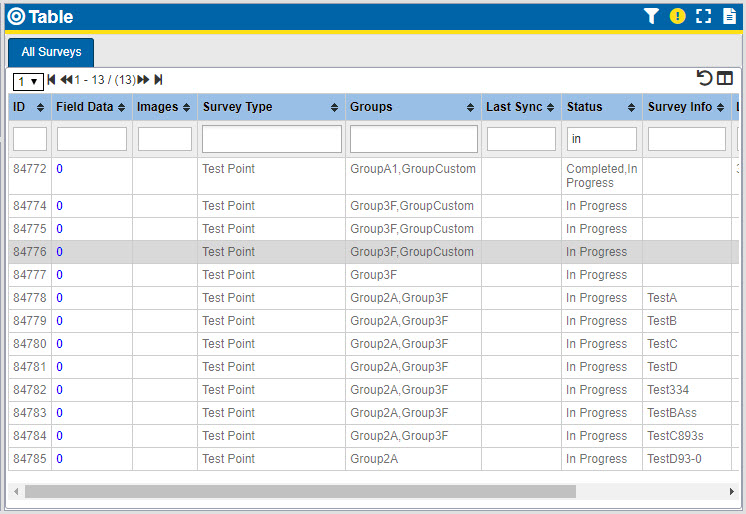
Filter data by column — To quickly find data based on a known value, find the column that would contain the known value. Enter text in the field provided below the column header to filter the table so it only shows data containing the entered value.
For example, the image below shows the Table filtered by Status with the text "in" added to the text box. The result is that only records with a Status that includes the word "in" are displayed. The result is displayed as soon as you type the text.

Table Filtered by Status
Sort data by column — To sort the table data based on a column's contents, click the column header until the data is sorted in the preferred order. An arrow pointing up indicates the data is sorted by that column in ascending order, an arrow pointing down indicates the data is sorted in descending order, and arrows pointing up and down indicate the data is not sorted by that column.
Reset Filter
If you have filtered the Table, you can reset the contents to their original display by clicking the ![]() icon located above the column names.
icon located above the column names.
Adjust Columns
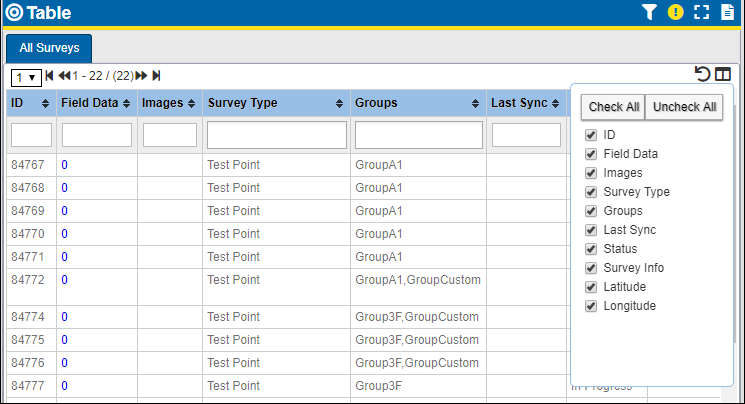
The columns shown in the Table can be selected to be shown or hidden. Click the ![]() icon shown above the column name.
icon shown above the column name.

Adjust Columns Window
-
Select Check All to have all columns display in the Table.
-
Select Uncheck All to have no columns display in the Table.
-
Select or de-select column names as desired.
Zoom to Selection
Right-click on a record and select Zoom to Selection to view the data point on the Map pane. If the data point includes GPS location, the Map pane will zoom in to its locations. Refer to View Data in the Map for additional information.
Add Selection(s) to Group
Right-click on a record and select Add Selection(s) to Group to add the record to the Groups pane. Refer to Create Groups and Assign Survey Files for additional information.