View Data in the Map
The Map pane plots the geolocated data points for the selected survey on a standard map if the survey record contains a GPS location.
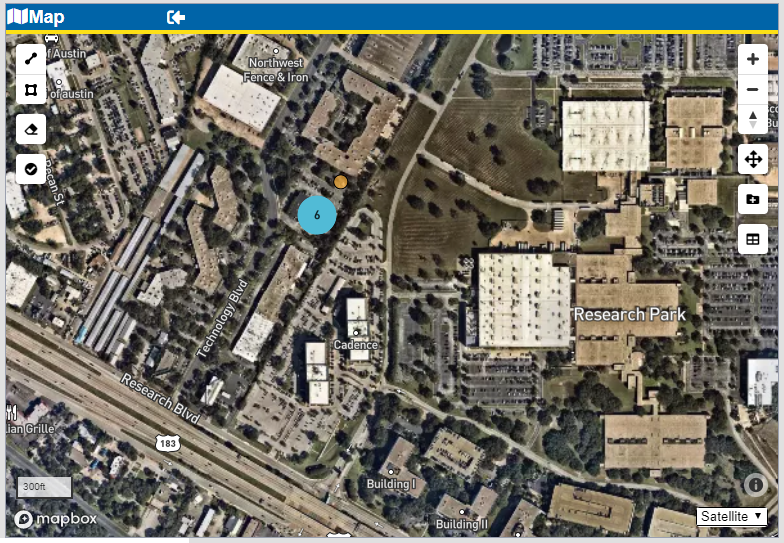
Map Pane with Data Points
You can manipulate the view of the map with any of the following methods:
-
Zoom in and out incrementally — Double-click a location on the map to zoom in on that location or click
 to zoom in on the center of the map view. Press Shift on the keyboard and double-click a location on the map to zoom out on that location or click
  to zoom out on the center of the map view.
 -
Zoom in on an area — Press Shift on the keyboard and click and drag to highlight an area on the map. Release the mouse to zoom in on the location highlighted.
As you zoom in, the survey data points will change from the cluster (circle with number of points in that area, as shown above) to show the individual points. You can also remove the clustering of data points by clicking the
 icon. The icon changes to
  when clustering is off.
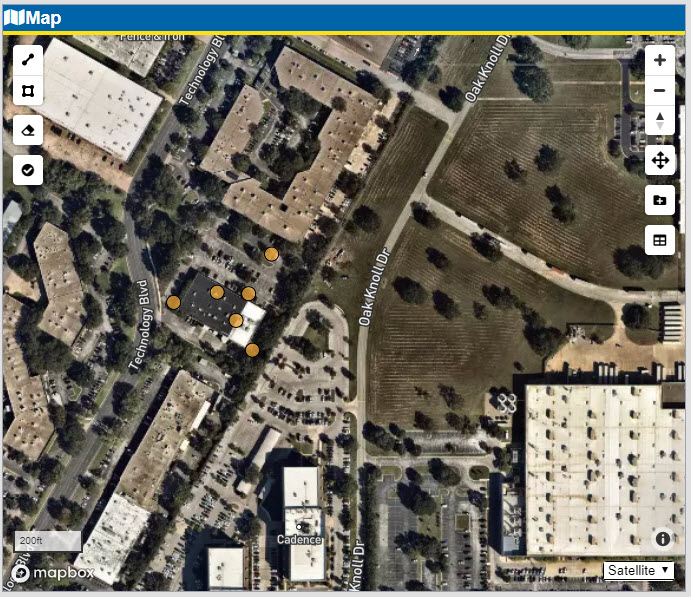
Data Points Zoomed In
-
Move the map — Click and drag in the map or click in the map and press the Up, Down, Left, or Right arrows on the keyboard to move the map view to the desired location.
-
Zoom to Extent— Click
 to zoom out to a distance where are points are included in the map.
 -
Change the base map — The current view type is listed in the bottom right corner of the map. To switch from the Satellite view to Streets or Terrain view, select the drop-down and choose the desired view. Your selected map view for the current survey will be remembered if you navigate to a different survey's data and then go back to the current survey.
Add Lines or Shapes
You can add visual markers to the map, such as a box around the survey points:
Draw a line — Click the ![]() icon and then click on the map where the line should begin. Move your mouse to the second point where the line will end. To continue drawing lines, click and move the mouse. To finish drawing lines, double-click the mouse button. The line then displays in blue.
icon and then click on the map where the line should begin. Move your mouse to the second point where the line will end. To continue drawing lines, click and move the mouse. To finish drawing lines, double-click the mouse button. The line then displays in blue.
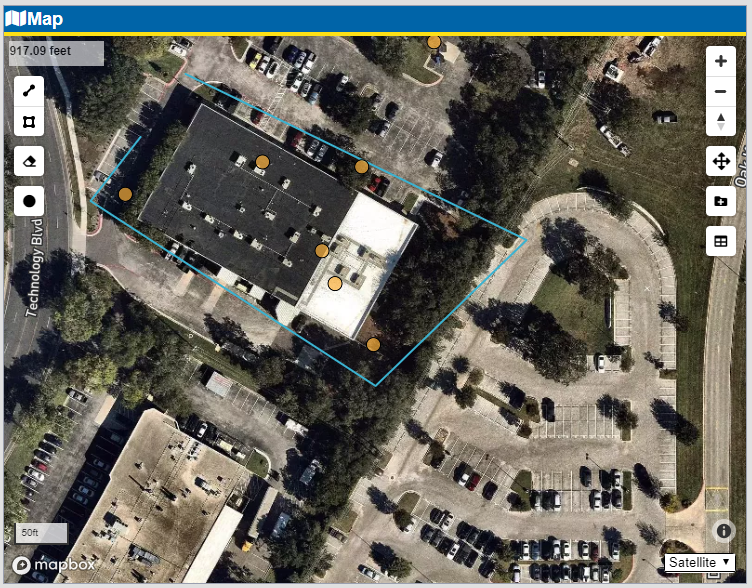
Map Pane with Line Drawn
Draw a polygon — Click the ![]() and then click on the map to drop the first point of the polygon. Move the mouse to the second point of the polygon. Click the mouse for each point of the polygon. To finish drawing the polygon, double-click the mouse button. The selected area is outlined and the data points change to pink with a blue circle. These data points are ready to be sent to a Group or listed in a table below the map. Refer to Create Groups and Assign Survey Files for more information on adding data points from the map to a Group.
and then click on the map to drop the first point of the polygon. Move the mouse to the second point of the polygon. Click the mouse for each point of the polygon. To finish drawing the polygon, double-click the mouse button. The selected area is outlined and the data points change to pink with a blue circle. These data points are ready to be sent to a Group or listed in a table below the map. Refer to Create Groups and Assign Survey Files for more information on adding data points from the map to a Group.
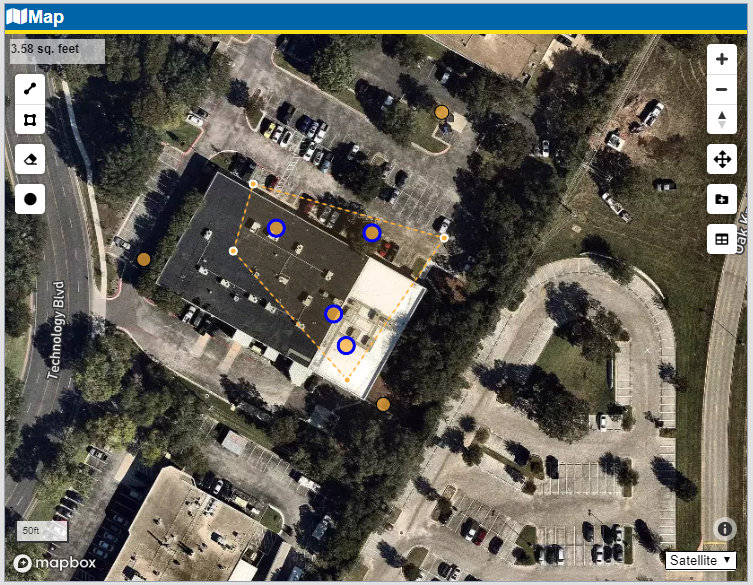
Polygon Draw On Map
Remove Drawn Objects
To clear the map of all drawn objects, click the ![]() icon.
icon.
Add Map Selection to Group
After you have selected data points on the map, they can be added to a group. Click the ![]() on the right side of the map. Refer to Create Groups and Assign Survey Files for additional information.
on the right side of the map. Refer to Create Groups and Assign Survey Files for additional information.
Show Selection Details
After you have selected data points on the map, you can view details about them in a table below the map. Click ![]() on the right side of the map. A table displays below the map with details about the data points. Click the icon again to hide the table.
on the right side of the map. A table displays below the map with details about the data points. Click the icon again to hide the table.
View Data Point Info on Map
Click a data point to open a Object Info window that contains survey data about that point.
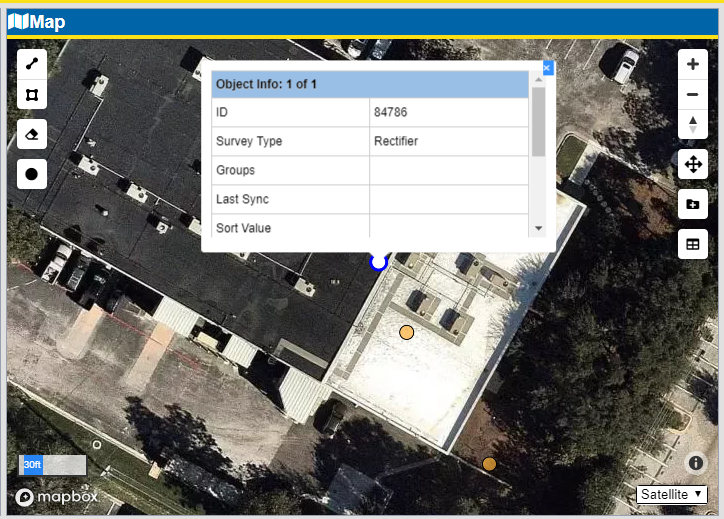
Object Info Window