Monitor Page
The Monitor page can be used to view units on a map or to monitor events, such as pipeline pigging status. Only units configured with an alert that includes Event Monitoring and icons will be shown on the Monitor page's different views. Refer to Create an Alert for more information on adding display icons and the option to use the icons for Event Monitoring. Refer to Event Monitoring for more information about setting up units for Event Monitoring.
Complete the following steps to view units on the Monitor page:
-
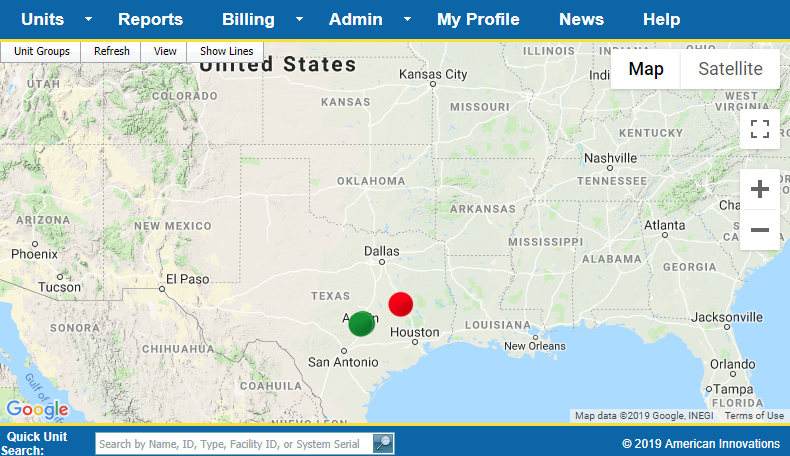
Hover your mouse over Units on the main menu and then select Monitor. The map view is the default view.

Map View with Unit Icons
Only the units set up with an alert that includes the option to use the alert for Event Monitoring will display as an icon on its installed location.
-
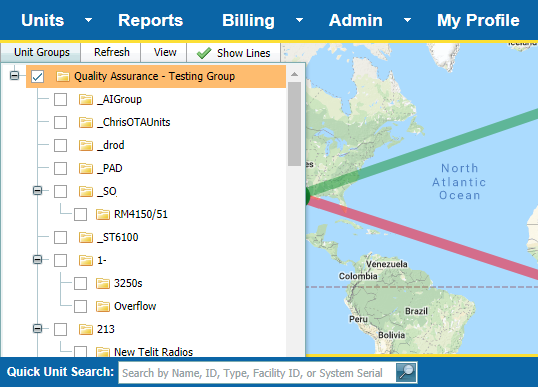
To view connection lines, click Show Lines. Lines between the units are based on the Group Info setting on the Unit Admin page. Refer to Unit Admin Page for more information on this setting.

Group Info Definition for Monitoring Lines
-
To select one or more unit groups to display on the map or in tables, hover your mouse over Unit Groups and check one or more Unit Group check boxes.

Unit Groups Selection
-
To view how unit status is displayed, hover your mouse over View and select one of the following options:
-
Map: Current status presented in map view.
-
Table: List of current Alerts (Events) for each unit in the selected unit group.
-
History: List of all Alerts (Events) based on a specified date range for each unit in a selected unit group. Select a date range from the drop-down fields above the table.
-
-
To modify when how often data updates when using any of the viewing modes, hover your mouse over Refresh and select a time option.