KPI Dashboard
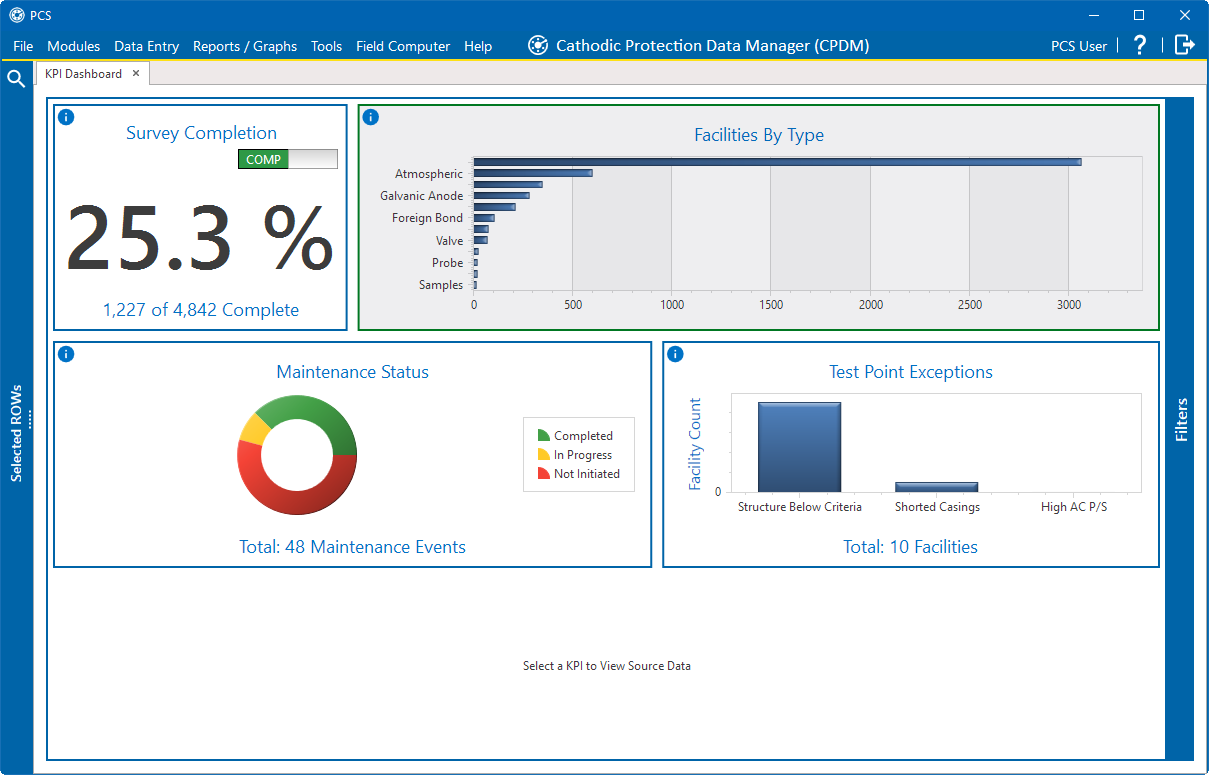
Key performance indicators (KPIs) are displayed on a dashboard for easy access to database information.
The dashboard can be access through the Reports/Graphs > Dashboard menu.

KPI Dashboard
Before data can be visualized on the dashboard, you must run four bridge definitions. Refer to Set Up the KPI Dashboard for additional information.
The dashboard includes the following KPIs:
-
Survey Completion — displays the percentage of facilities that have an inspection marked as Surveyed in the filtered date range in the current hierarchy selection.
-
Facilities by Type — displays the number of facilities in the current hierarchy selection.
-
Maintenance Status — displays the current status of all maintenance items that fall into the filtered date range in the current hierarchy selection.
-
Test Point Exceptions — displays the number of exception for the most recent inspection records that violates the following criteria:
-
Structure Below Criteria: shows the number of inspections that are not meeting their defined Test Point Protection Criteria.
-
Shorted Casing: shows the number of inspections that have a Structure P/S-Casing P/S within the threshold defined in Options.
-
High AC P/S: shows the number of inspections that have and AC PS reading greater than 3.
-
You can view source data associated with any of the KPIs by selecting a subsection of an individual KPI. Refer to Drill Down into Dashboard Data for additional information.
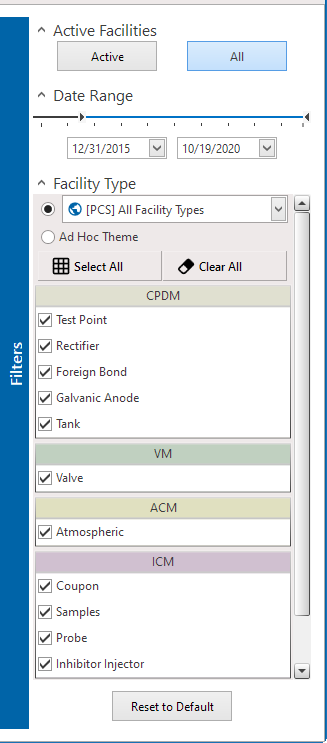
The dashboard can be filtered by active facilities, date range, and facility type.

Dashboard Filters
-
Facility Type — select a facility type theme or Ad Hoc Theme. For Ad Hoc Theme, select either
 Select All or individual facility types.
 -
Active Facilities — select either Active or All.
-
Date Range — select begin and end dates from the drop-down fields. You can also use the slider above the fields to adjust either date.

Date Range Slider
-
Click and slide the
 icon on the slider to adjust the begin date.
 -
Click and slide the
 icon on the slider to adjust the end date.
-
-
Reset to Default — resets the filter to original settings.
The KPI Dashboard updates as changes are made.