Set Up the KPI Dashboard
The data that is displayed on the KPI (key performance indicators) Dashboard (Reports/Graphs > Dashboard) comes directly from your database.
When first setting up PCS 2.5 you must run four bridge definitions that are automatically added to your list of bridge definitions. For the dashboard to update on an automated basis, ensure that the dashboard has been configured to run automatically to ensure that all changes to the database are captured and available to display on the dashboard. Refer to Set Basic Bridge Definition Properties for more information on setting schedules for Bridge definitions.
Changes to the database will not be available for display on the dashboard until the four dashboard bridge definitions are run.
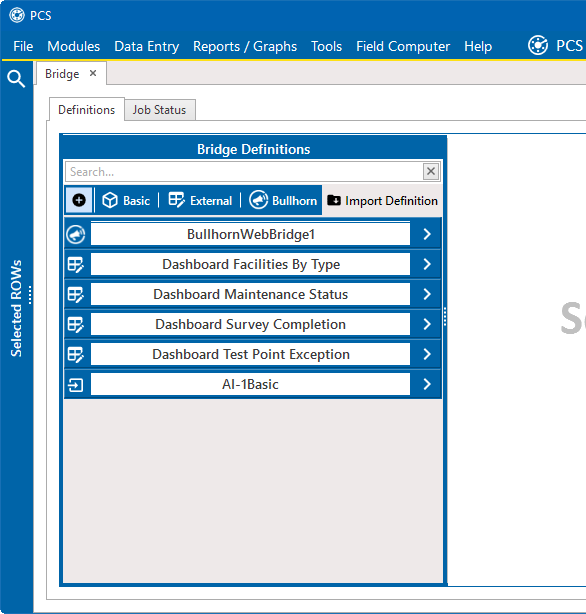
The pre-defined bridge definitions that are used to populate the KPI Dashboard include:
-
Dashboard Facilities by Type
-
Dashboard Maintenance Status
-
Dashboard Survey Completion
-
Dashboard Test Point Exception
Complete the following steps to schedule and run the four bridge definitions:
-
From the main menu, click Tools > Bridge to open the Bridge window.

Bridge Window - Dashboard Definitions
-
Complete the following steps for each of the four Dashboard bridge definitions:
-
Select the bridge definition.
-
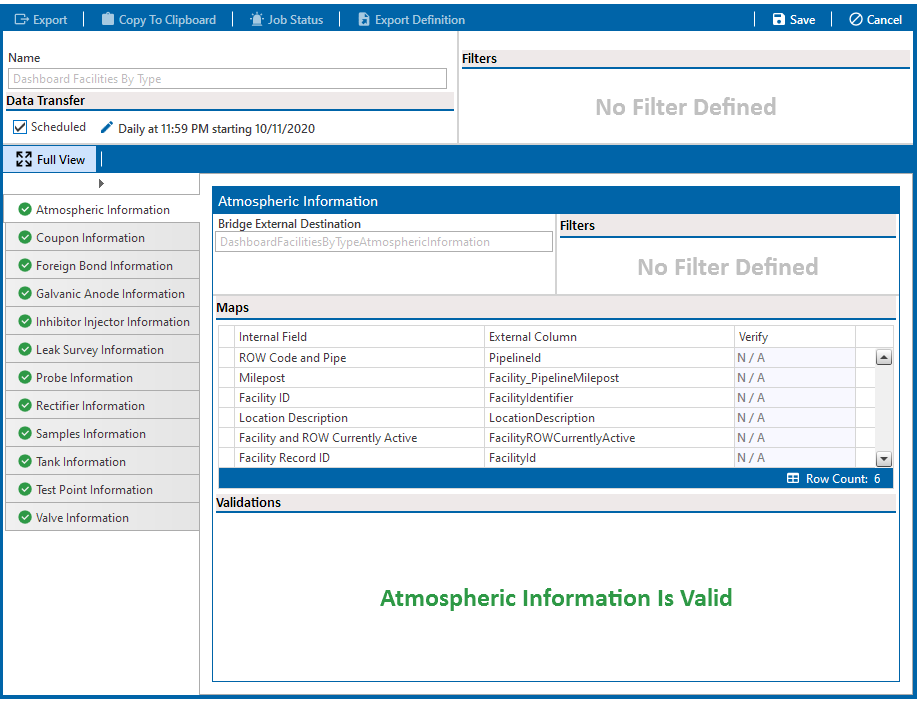
Select Scheduled check box. The default setting is daily.

Scheduled Bridge Definition
-
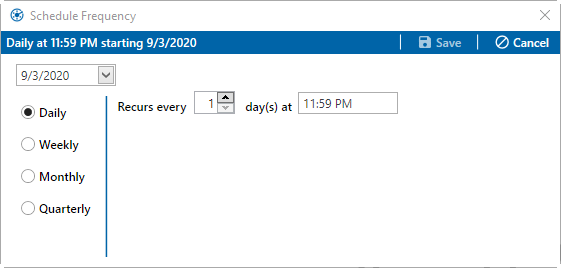
Click the
 icon to open the Schedule Frequency window and set the date to current date and the time to a convenient time for your organization. Click Save to close the window.
Schedule Frequency Window
-
Click Save in the Bridge window.
-
Click
 Export.
-