Customize the Chart Display
The SnapView Chart display can be customized.
Refer to Overlays for more information on customizing the Chart display for an Overlay.
Complete the following steps to customize the look of the Chart pane's X-axis basis and line options:
-
Click the
 icon in the Chart pane banner. The SnapView Chart Options window displays.
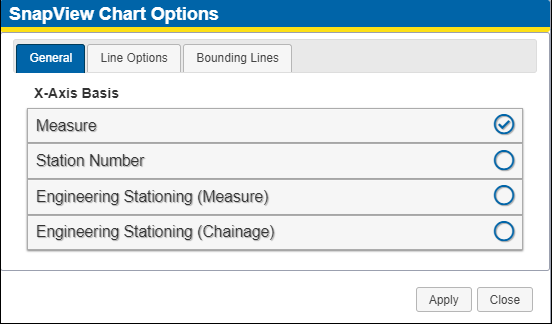
SnapView Chart Options - General
-
Select one of the options for the X-axis basis.
-
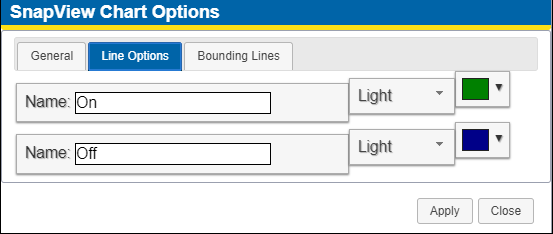
Click the Line Options tab.

SnapView Chart Options - Line Options
-
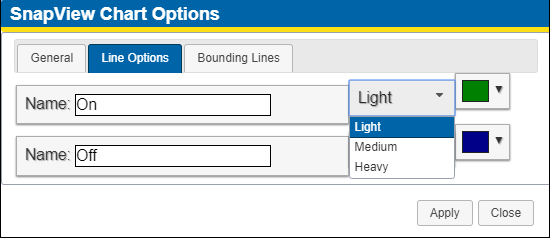
Edit Name fields and select a line weight and color for each.

SnapView Chart Options - Line Weights
-
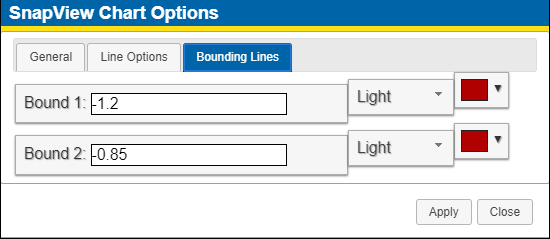
Click Bounding Lines tab.

SnapView Chart Options - Bounding Lines
-
Edit Name fields and select a line weight and color for each.
-
Click Apply.