View Data in the Table
The Table pane displays the selected survey segments' data in a standard table format of columns and rows. If there are more than 250 rows worth of survey data, the table will be further divided into pages of data. Some of the cells' data, such as the Remarks field, can be edited by double-clicking in the cell and entering a new value.

Table Pane
For a list of column names and their descriptions, refer to Table Column Descriptions.
Navigate Between Pages of Data
Up to 250 rows of survey data can show at a time. If the row of survey data you wish to see is not visible on the table, use the page navigation options to locate the survey data.

Page Navigation Options
Click the left or right double arrows to move to the previous or next set of survey data, respectively. To move to the first or last set of survey data, click the left start arrow or the right end arrow. To jump to a specific page in the table, select the page number drop down and select the desired page from the list.
Determine Column Order and Visibility
Determine column order — Click and drag the column header and move it to the right or left of another column to rearrange the order of the columns.
Determine column visibility — To show or hide a column from the table, click ![]() to open the Adjust Columns menu. Select or deselect the check box next to a column name to show or hide it from the table, respectively.
to open the Adjust Columns menu. Select or deselect the check box next to a column name to show or hide it from the table, respectively.
Filter or Sort Data by Column
Filter data by column — To quickly find data based on a known value, find the column that would contain the known value. Enter text in the field provided below the column header to filter the table so it only shows data containing the entered value.
Sort data by column — To sort the table data based on a column's contents, click the column header until the data is sorted in the preferred order. An arrow pointing up indicates the data is sorted by that column in ascending order, an arrow pointing down indicates the data is sorted in descending order, and arrows pointing up and down indicate the data is not sorted by that column.
Zoom to a Row's Data in Other Panes
Press the Ctrl on the keyboard and click a row of survey data in the column. Both the map and chart zoom in close enough to see the selected data point's location.
Export Data for External Use
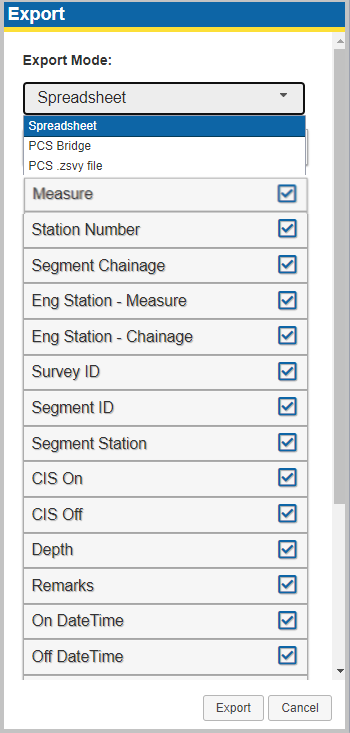
To export data for use in other applications, such as PCS, PCS Field Data Collector, or Microsoft Excel, right click the loaded survey in the Survey Segments sidebar. The Export window opens.

Export Window
Select whether you are exporting to an Excel file, exporting to the PCS Bridge, or to a PCS-compatible .zsvy file from the Export Mode drop-down. Depending on the export file type, the following options may be available:
-
Select a segment, date, and run value from the drop-downs provided (for PCS Bridge exports)
-
Select or deselect columns to be included in the export (for Excel or PCS Bridge exports)
Select the desired options and click Export. The exported data is saved in the file format selected in your browser's default downloads folder.
Send Survey Data to SnapView
The table's survey data can be sent to the SnapView module where it can be aligned with and compared to other data for more in-depth analysis. Click ![]() to open the Send to SnapView window.
to open the Send to SnapView window.

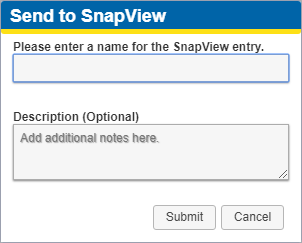
Send to SnapView
Enter a name for the survey data being sent to SnapView and, if desired, enter a description of the data in the fields provided. Click Submit to send the data to the SnapView module. Refer to SnapView Module for additional information.