Recommendation for Linear Graph Templates
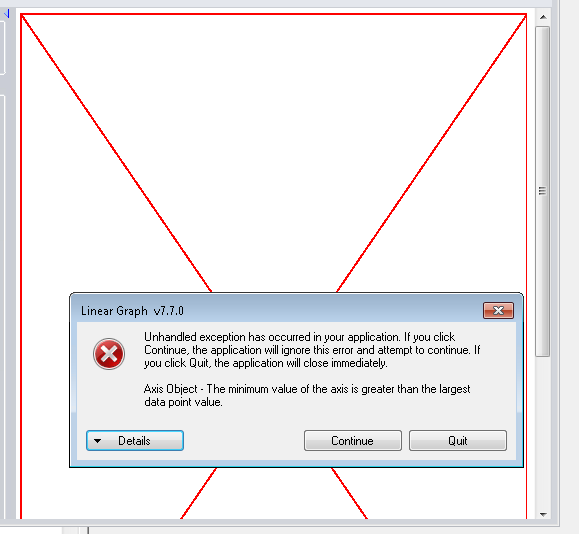
When using linear graph templates, be sure to save the template with specified y-axis range values to avoid having an exception, which adds a red box in the graphing area.
The exception is seen when, while in the linear graph workspace (Report>>Linear Graph), a user selects Chart and then Open Graph Template.
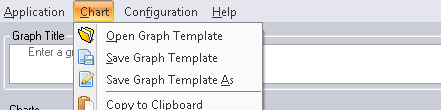
Once a template is selected and there is no y-axis range value specified in it, the error will display as shown below:
The Y Axis can be specified by manipulating the values seen below:
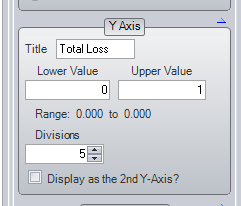
Once the y axis values are adjusted appropriately, the linear graph will not throw an exception.