How to Align Anomalies for Multiple ILI Surveys
You may need to compare features (or anomalies) reported in multiple ILI surveys to understand potential corrosion growth over time and the remaining strength of the corroded pipe. The following steps describe how to analyze, transform, and buffer ILI data, including the calculations that will be used to combine the two aggregation evaluation results.
-
The first step is to analyze the number of ILI surveys that are currently stored for each pipeline. If there are more than 2 ILI surveys, it will be necessary to create an additional input model to store the data for the previous ILI survey, the latest ILI survey can still be stored in regular ILI data model (see diagrams at end of document for two different possible paths depending on data)
-
The second step is to transform the ILI data into a common base reference system so the data can be compared. It is recommended to use as many fit points as possible so individual anomalies can be aligned. If using the 1 input model method, it is recommended to use parent/child relationships so you can transform each survey separately.
-
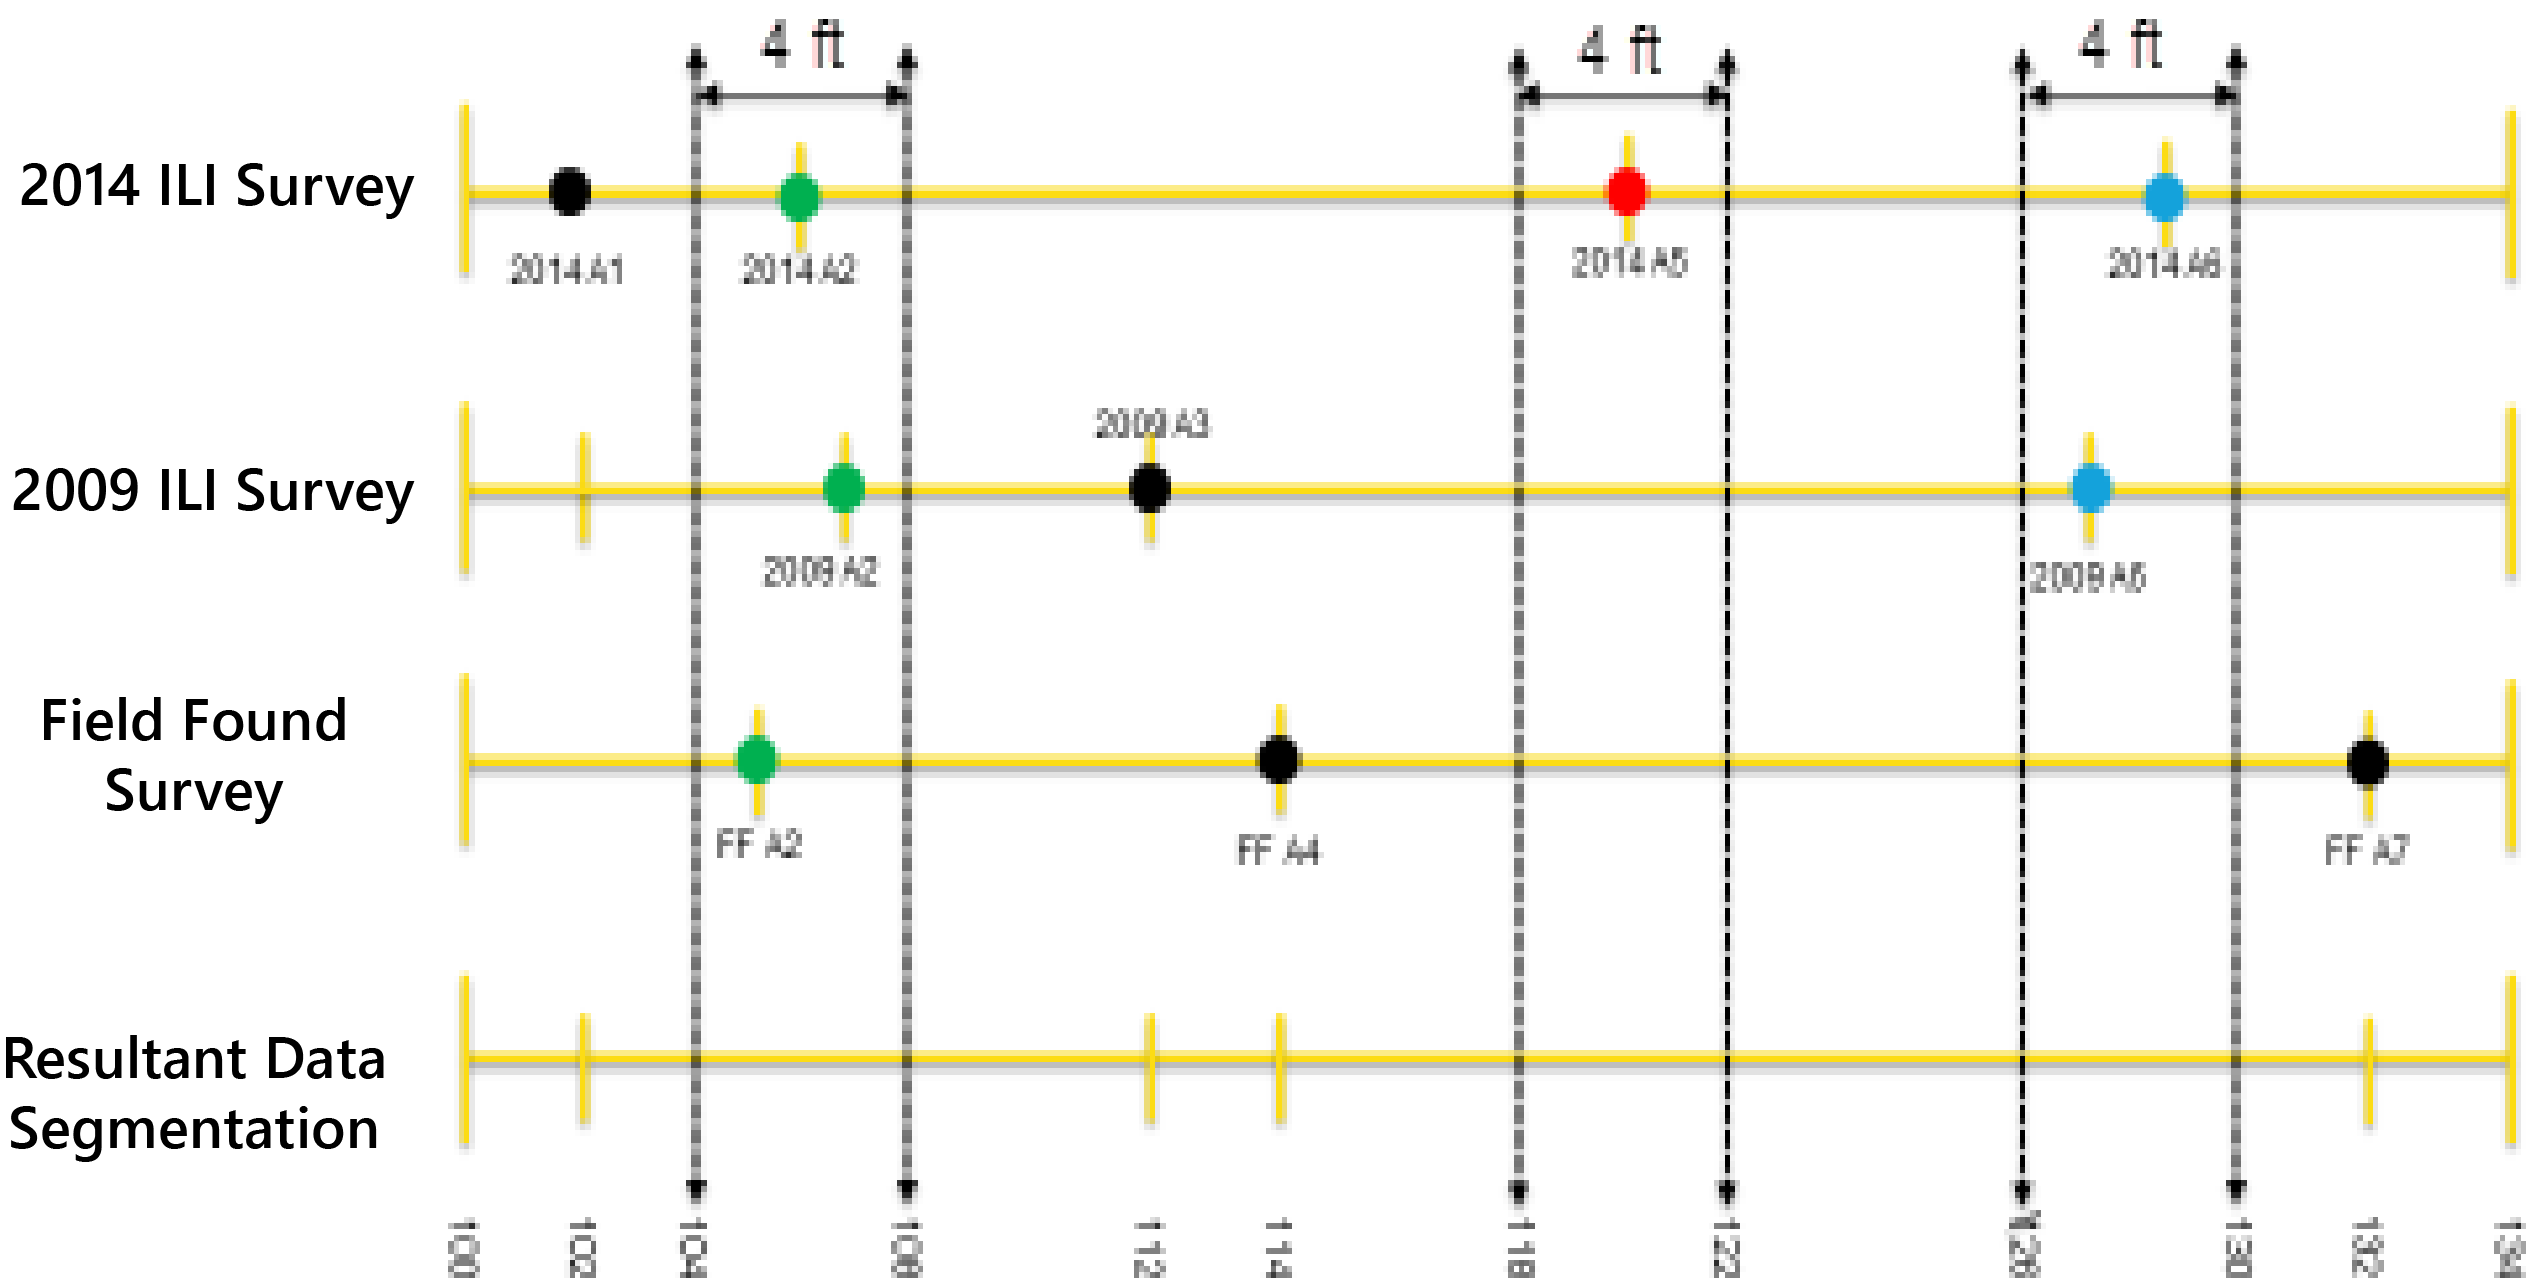
The third step is to buffer the point ILI data so that the same anomalies can be compared as even with a very good transform, anomalies will not be at the exactly the same point. See diagram below. If you are using the two input model method, you will need to build two buffer models.
-
After buffering the data, bring the data into an evaluation model. Depending on the work flow, the process splits here.
-
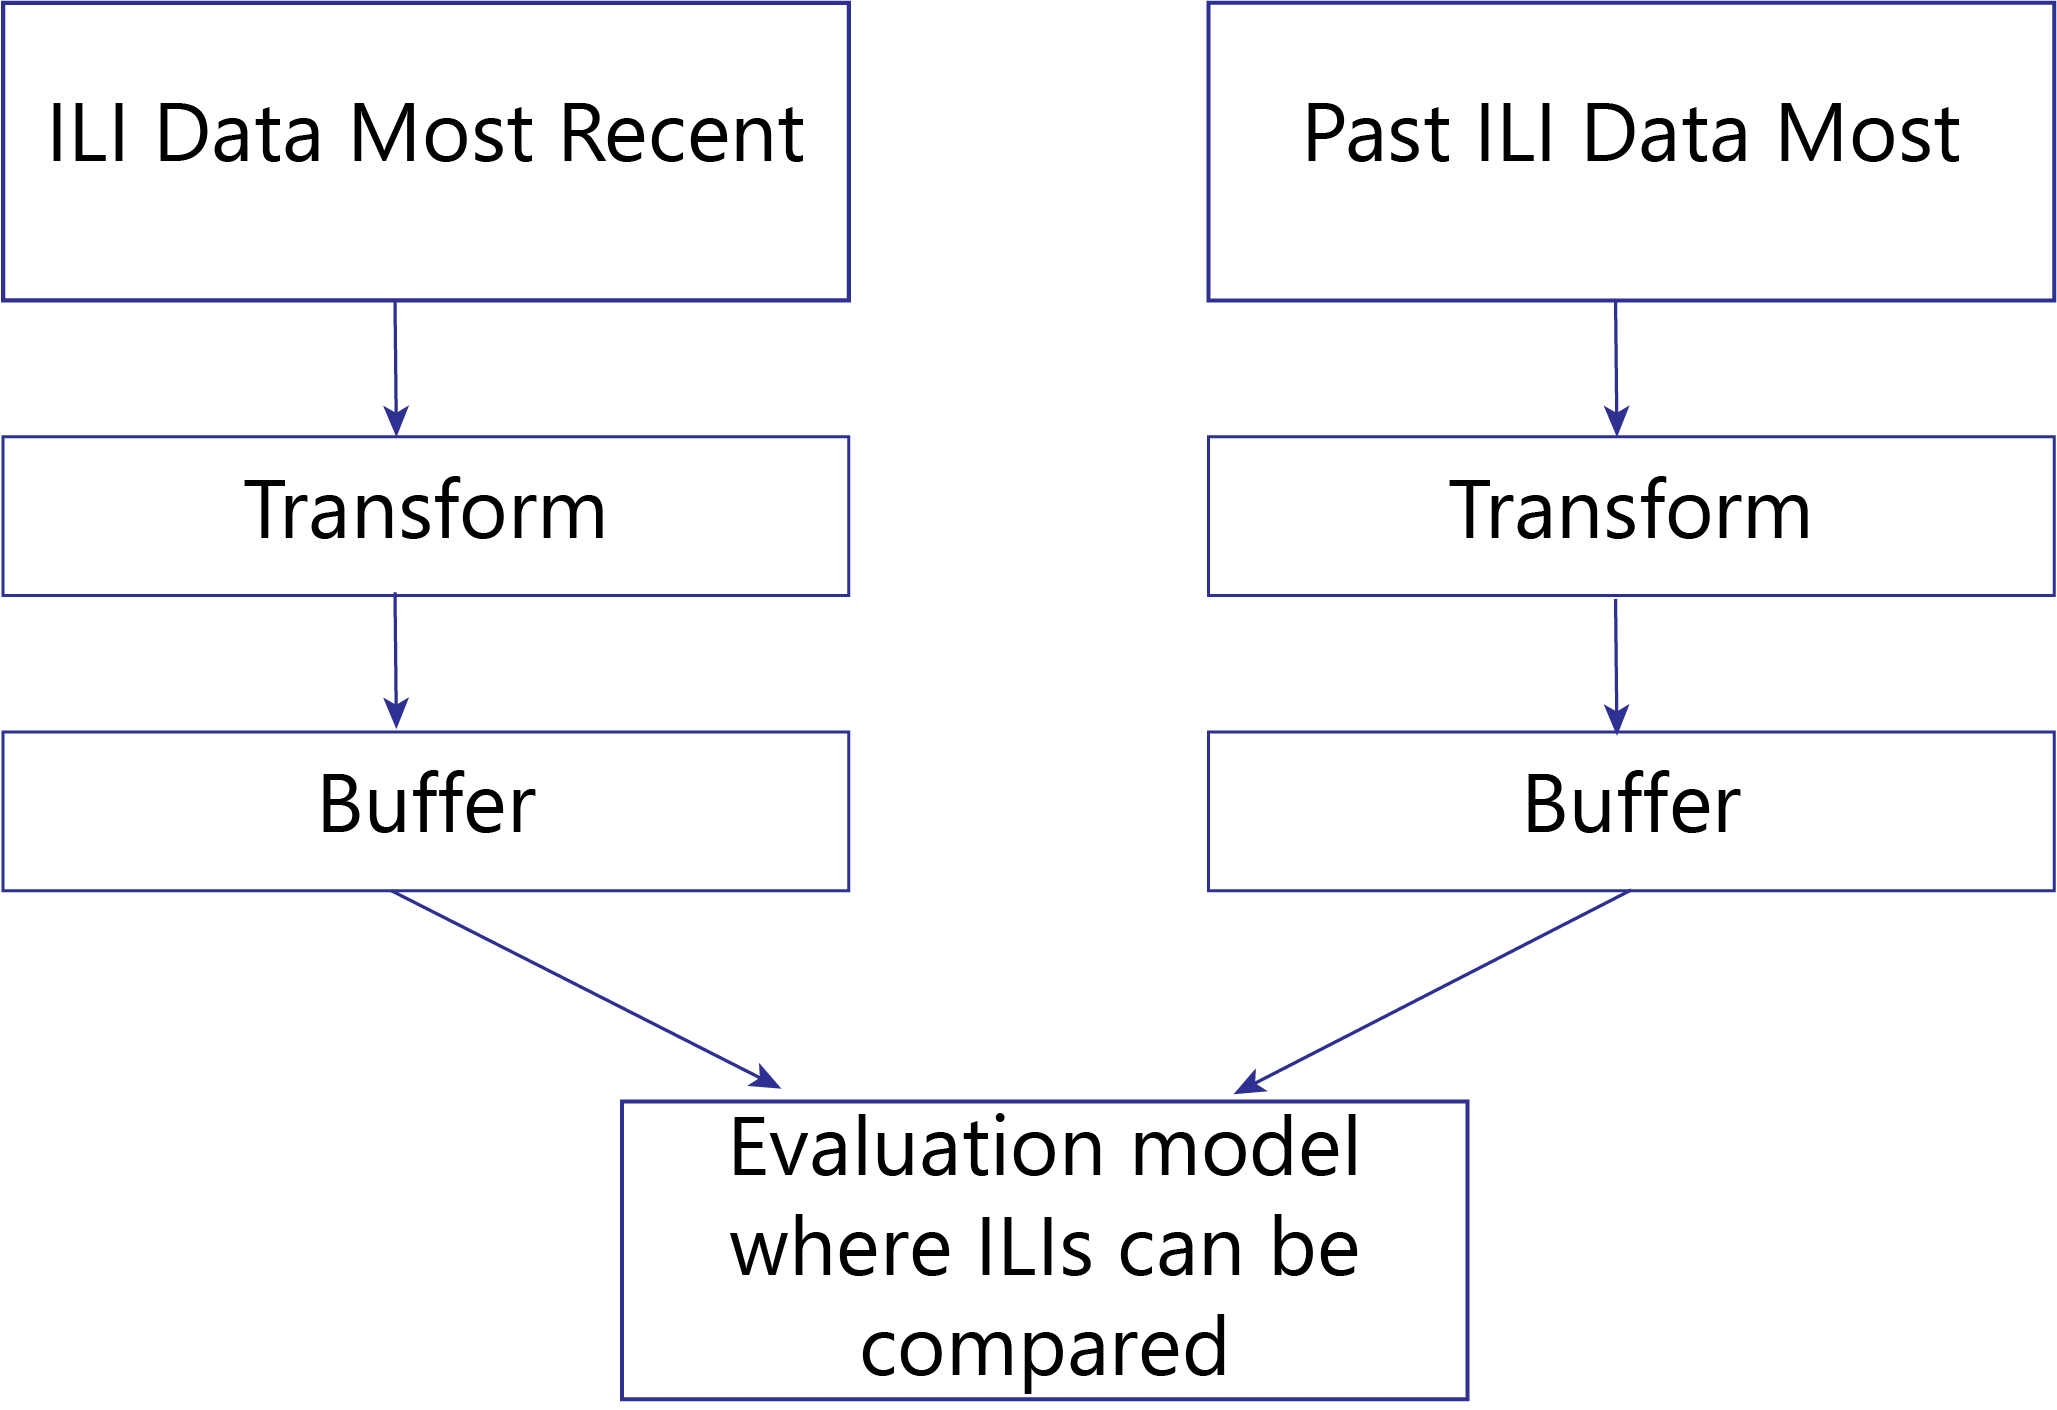
When using two separate input models (due to more than 2 ILIs in main ILI input model), build an evaluation model to bring both buffer models together. The anomalies can now be compared and calculations such corrosion growth and remaining strengths can be performed.
-
When using one input model with 2 ILI surveys in input model, do the following:
-
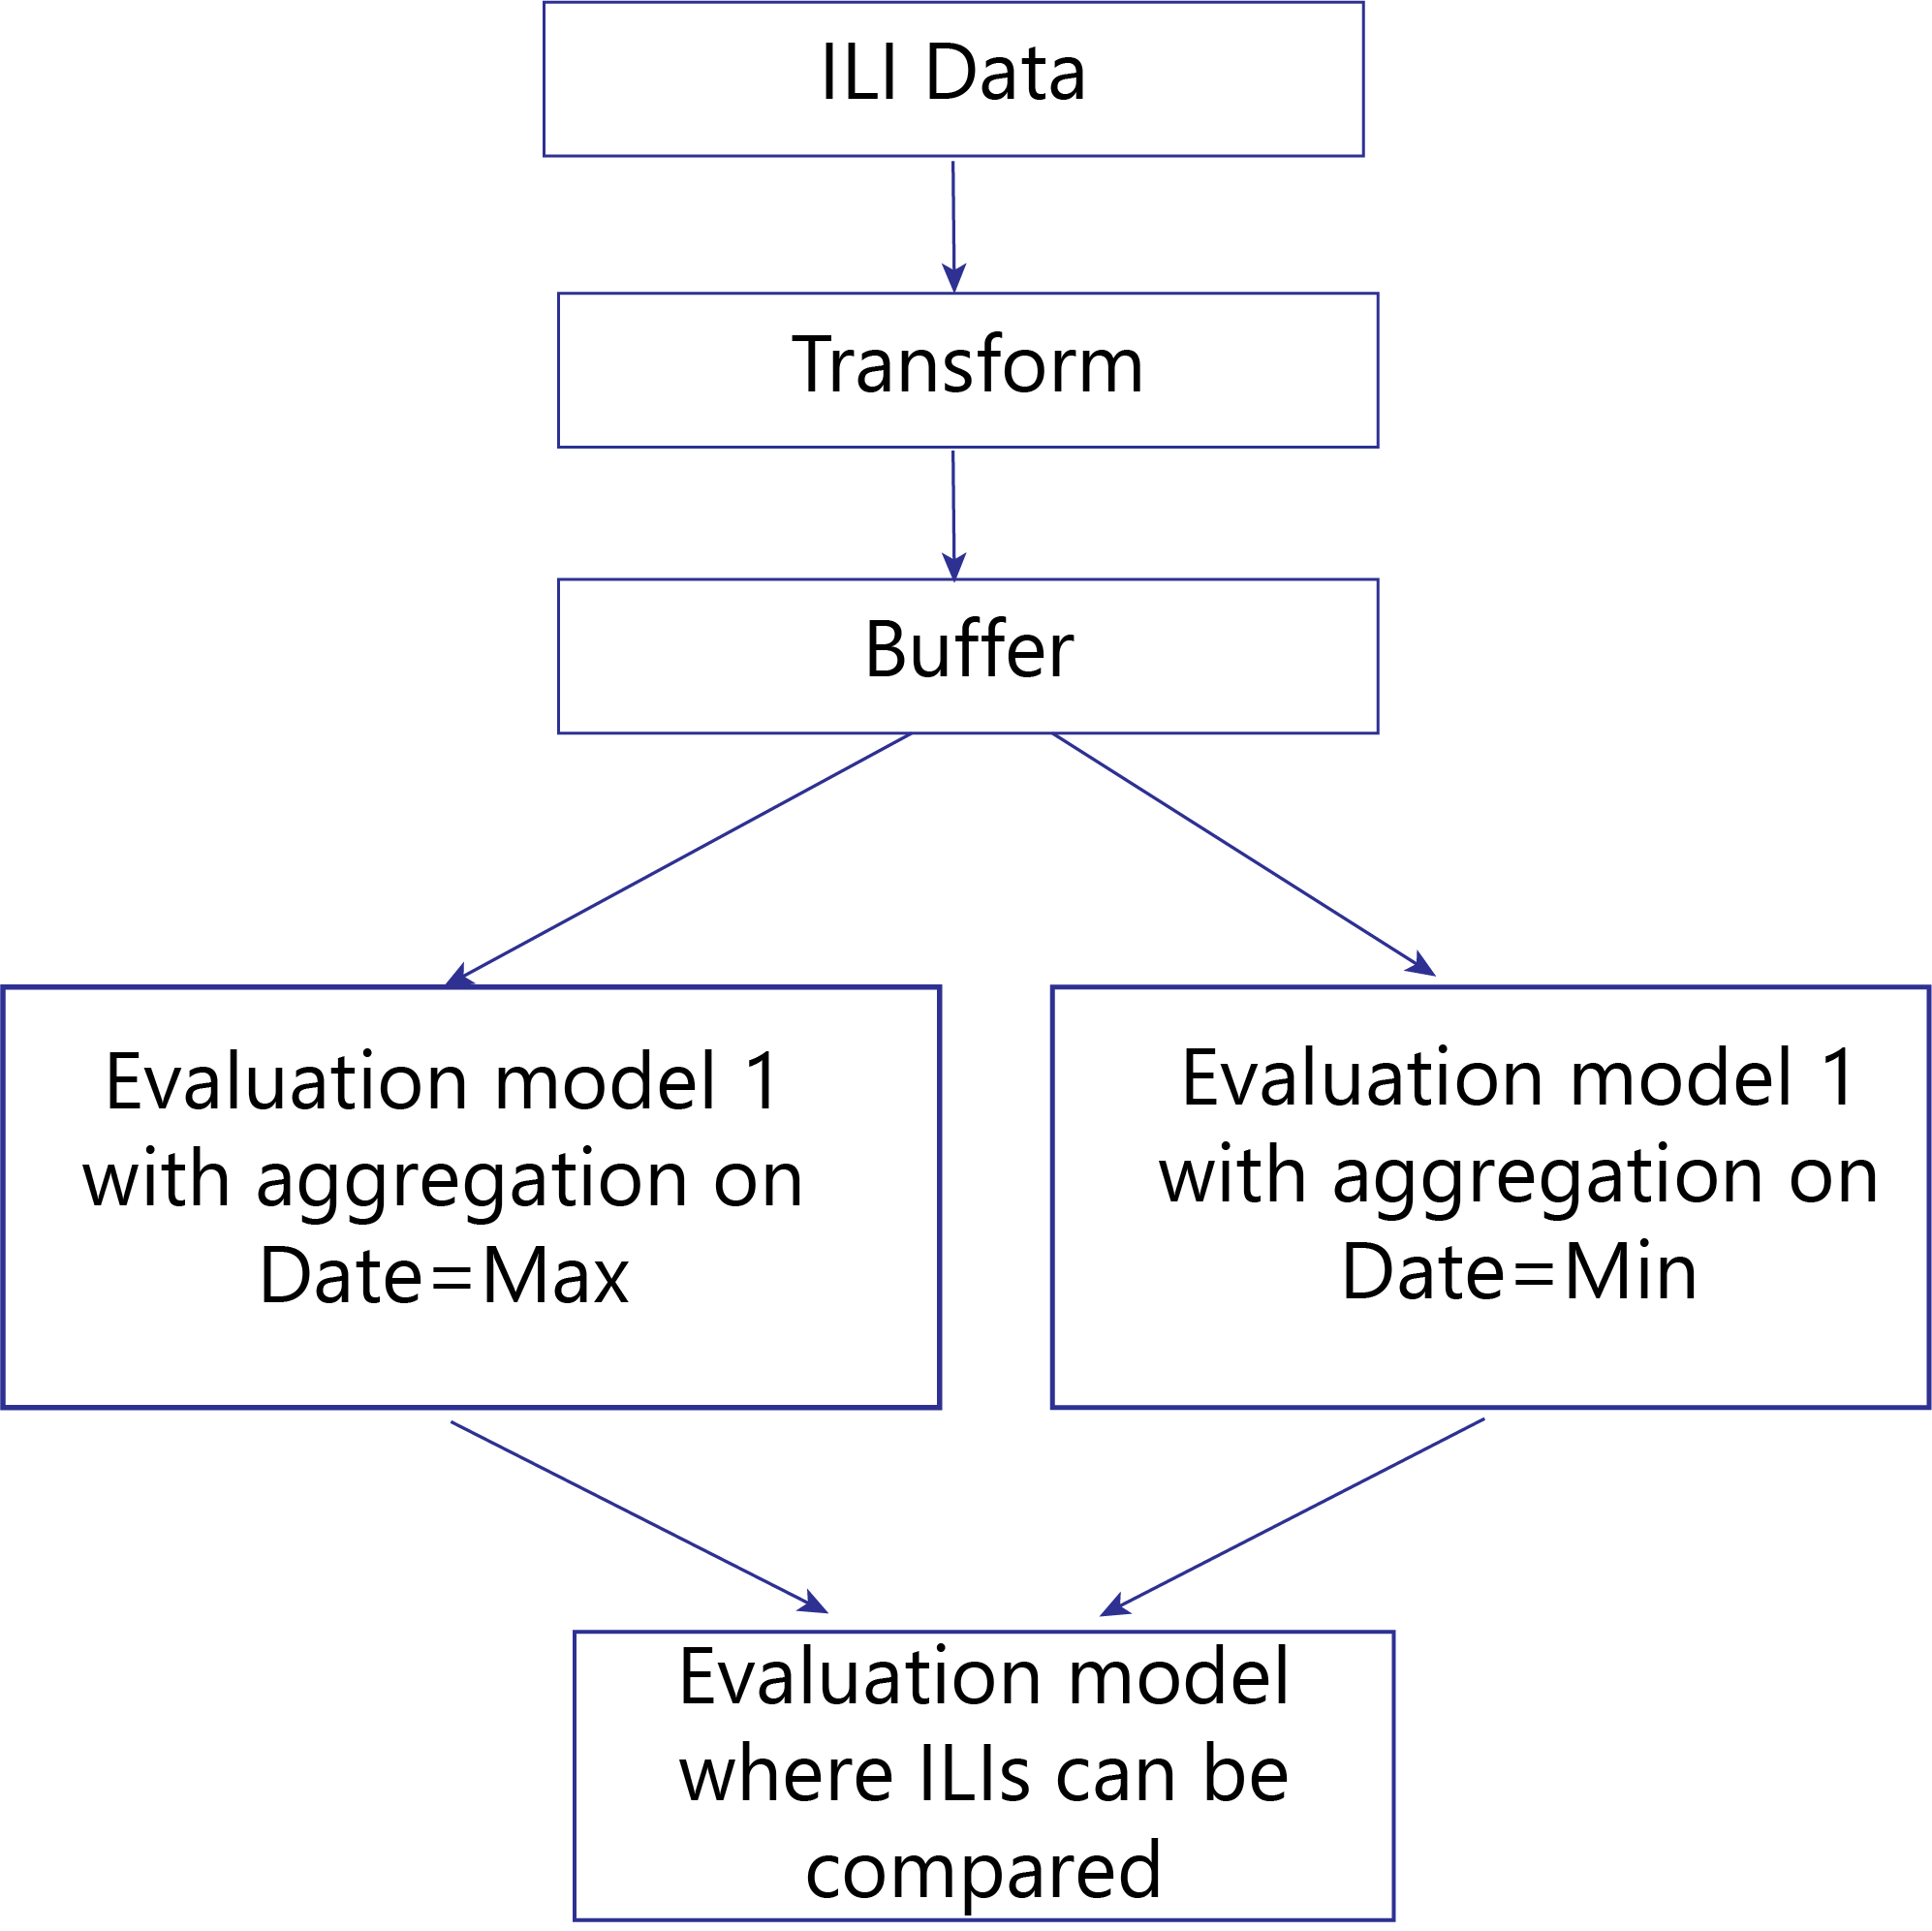
i. If there are 2 ILI surveys in the same input model, create 2 evaluations models: one with aggregation set on survey date = max and one with aggregation set on survey data=min.
-
Now create an evaluation to combine the two aggregation evaluations results. It is in this evaluation model that the anomalies are aligned, data can be compared, and calculations such corrosion growth and remaining strengths can be performed.
-
-
The following flow charts illustrate the work flow for more than 2 ILI surveys in the input mode.
Using two separate input models (due to more than 2 ILIs in main ILI input model)
Using one input model (only 2 ILI surveys in input model):