Shift Lines Options
You can create shift lines to display in the Overlay Chart to see if surveys are meeting the 100mV (or other millivolt value) protection criteria. The most common application is evaluating surveys to ensure at least 100mV of polarization over a Native/Depol survey to provide adequate protection from corrosion. Shift lines can be created off any of the potential lines in the Chart, which will persist to the Chart PDF reports.
Complete the following steps to configure shift lines on an Overlay.
-
Open an Overlay from the Navigation pane.
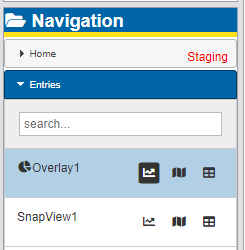
Overlay in SnapView Navigation Pane
-
Click
 icon to open the Chart pane for the Overlay.
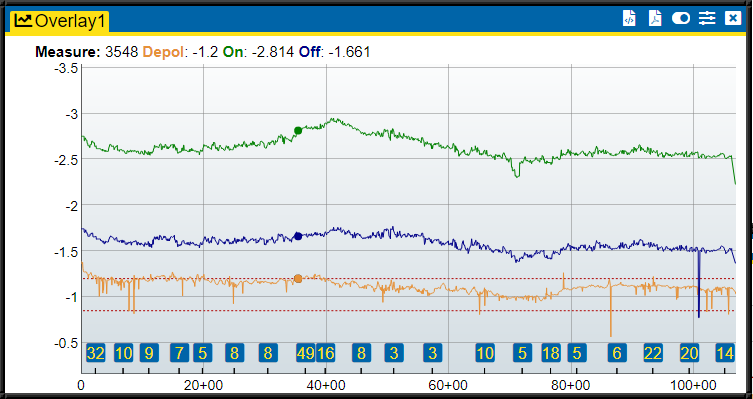
Overlay Chart Pane
-
Click the
 icon in the Chart pane banner. The SnapView Chart Options window displays.
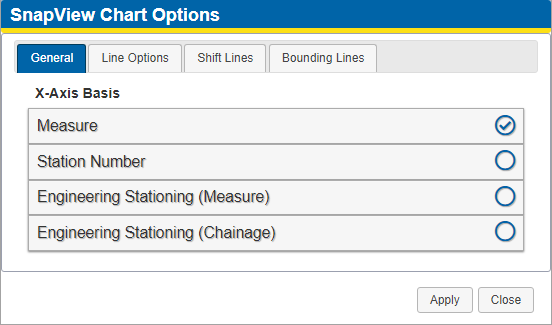
SnapView Chart Options - General
-
Click the Shift Lines tab.
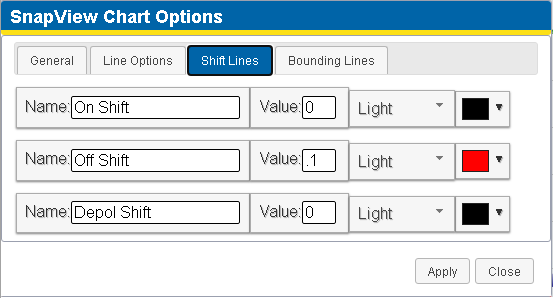
SnapView Chart Options - Shift Lines
-
For each shift line you want to add to the Chart, enter a name for the line in the Name field.
-
For each shift line you want to add to the Chart, enter a value for the line in the Value field. The Value is the number of volts difference from the original voltage that you want a reference to. For example, if you want a line that shows 100mV shift, enter .100 to draw a line 100mV in value more positive that the potential reading.
-
For each shift line you want to add to the Chart, select a line weight for the line from the first drop-down field.
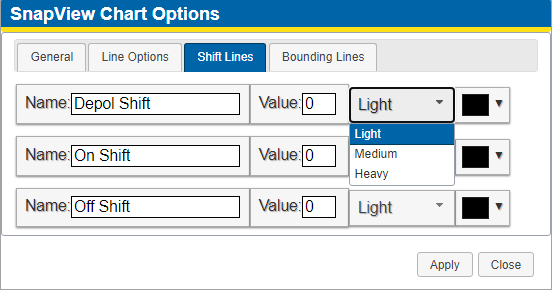
Shift Lines Weight Options
-
For each shift line you want to add to the Chart, select a display color from the color block drop-down field.
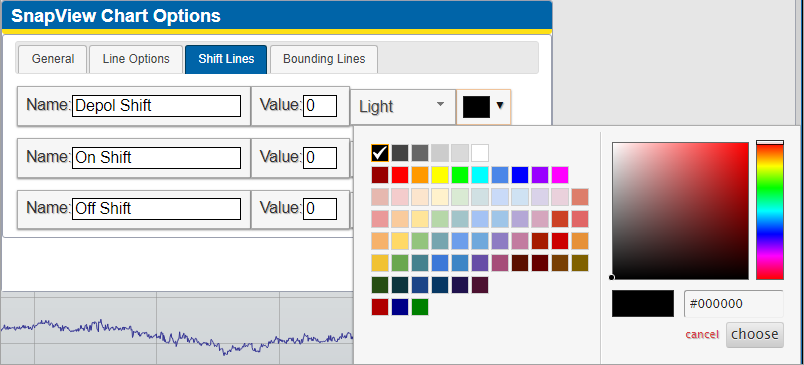
Shift Lines Color Options
-
-
Click Apply. The Chart is updated with the shift lines.
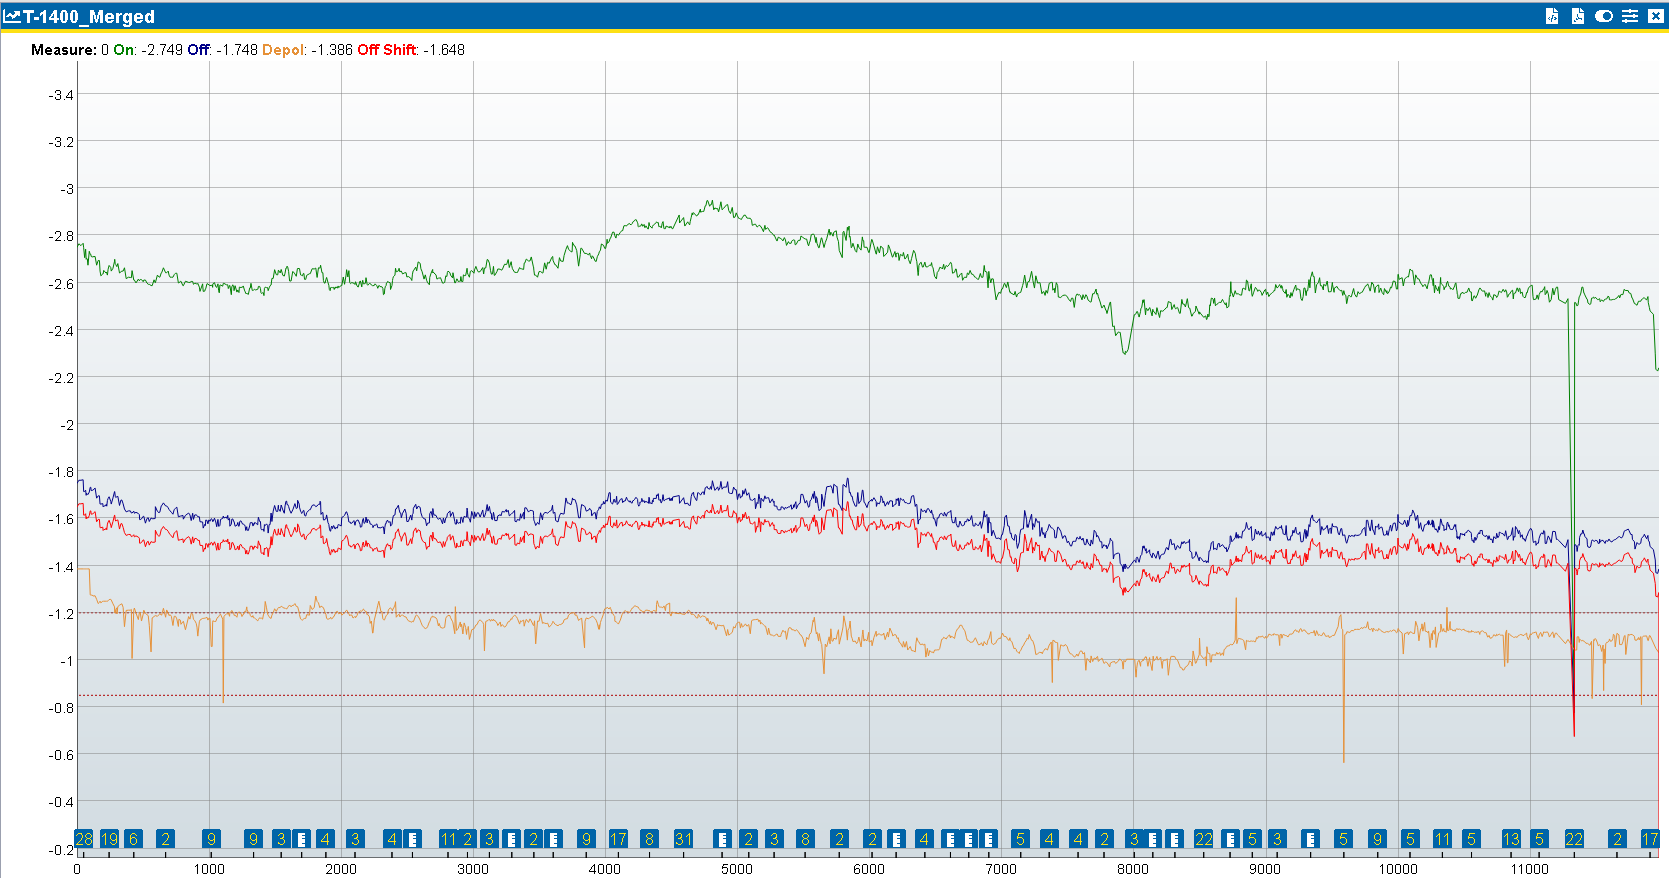
Overlay Chart with Shift Lines