Chart Options — CIS & Depol and DCVG Tabs
Click the CIS & Depol or DCVG tab on the Chart Options dialog window to adjust settings for these survey types.
CIS & Depol Options
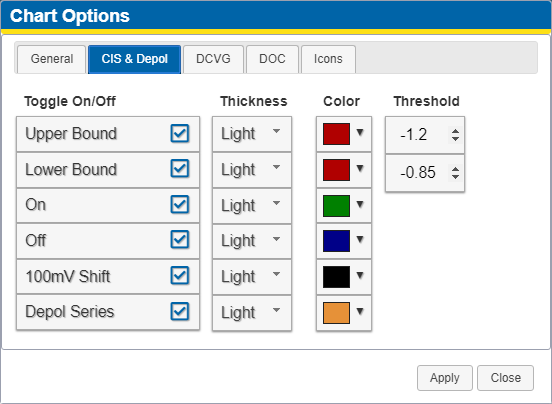
CIS & Depol Chart Options Tab
Toggle on or off options to show lines, set the thickness of the line, set the color of the line, and set the threshold for the Upper and Lower Bound.
DCVG Options
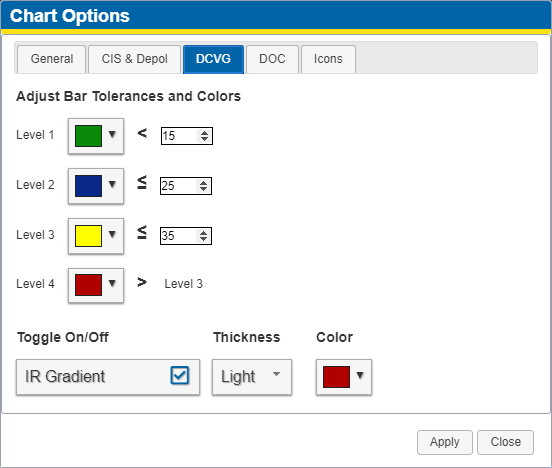
DCVG Chart Options Tab
-
Adjust Bar Tolerances and Colors:
-
Level 1: Selects a color that will represent Level 1.
-
Level 2: Selects a color that will represent Level 2.
-
Level 3: Selects a color that will represent Level 3.
-
Level 4: Selects a color that will represent xxxx greater than Level 3.
-
-
Toggle On/Off, Thickness, Color for IR Gradient— select the check box for IR Gradient to display. Also select line thickness and color.