Waveprint
The Waveprint option allows you to place the waveform that your are capturing to verify interruption is correct at the location where you did the verification. The waveprint will be attached to the record it pertains to. A and show up as an icon in the chart so you can visualize the waveform that the tech saw in the field when they verified interruption. You can also choose to include waveprints in the Chart PDF report.
A waveprint can only be linked to one location on one survey. A linked Waveprint is denoted by the ![]() icon in the chart annotations.
icon in the chart annotations.
When survey data is modified![]() to refresh the survey and load the updated data in all of the panes.
to refresh the survey and load the updated data in all of the panes.
Complete the following steps to add a waveprint to a point on the chart, view waveprint information, or unlink a waveprint:
-
Move your mouse to the point on the chart that you want to add the waveprint, right-click on the point to open the options menu, and select Waveprint.

Add Station Option - Waveprint
-
In the Select Wave Print window, select the waveprint from the drop-down.

Add Station Value Window
-
Click Confirm.
-
To view a list of lined waveprints, click
 on the Chart.
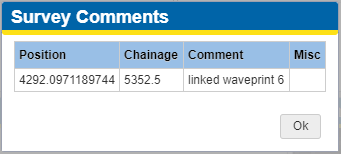
Survey Comments with Waveprint
-
Double-Clickthe entry to open the Waveprint window.

Waveprint Window
-
The shaded regions signify the on cycle, and the light regions indicate the off cycle.
-
The tick marks at the top and bottom represent 1s intervals.
-
Dotted vertical lines signify the time at which readings were taken.
-
-
To view the Waveprint data, press the
 icon.
icon. 
Waveprint Info Window
-
To unlink a waveprint from the survey, click Unlink.
Waveprint Window