Chart PDF
Complete the following steps to customize the Chart PDF report:
-
Select Chart PDF from the Report Tool drop-down list to display survey data in the standard chart format.
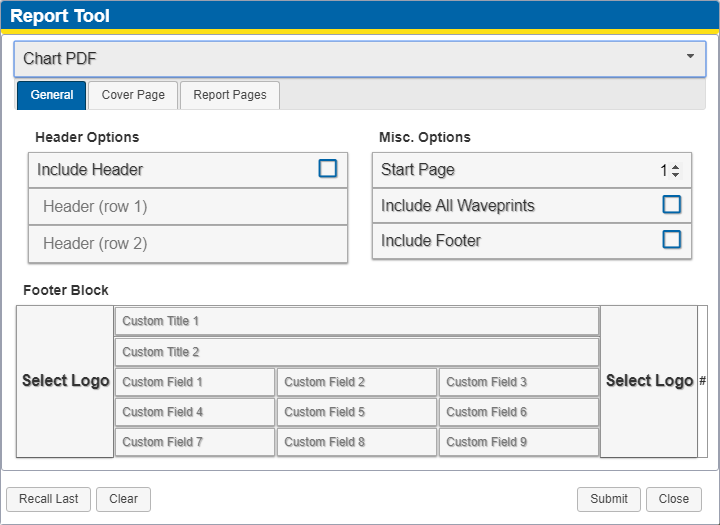
Report Tool - Chart PDF
-
To automatically fill the Chart PDF settings with the settings from the last time the report was run, click Recall Last.
-
Complete the following steps to configure or modify the set up of the header, footer, and other options of your report:
-
To include a header in the report, select the Include Header check box and enter header text in the Header (row 1) and (optionally) Header (row 2) text fields. Deselect the Include Header check box to leave the header of the PDF blank.
-
Enter the page number you want the charts to start with in the Start Page field. The page number included in the footer of first page of the PDF document will start with the page number entered.
-
To include the waveprints in the PDF or leave the waveprints out of the report, select or deselect the Include All Waveprints check box.
-
To include a footer in the report, select the Include Footer check box. Enter text in the Custom Title and Custom Field text fields as desired. Deselect the Include Footer check box to leave the footer of the PDF blank.
-
To include your company's logo or the logo of a partner company in the footer of the PDF, click either the left or right Select Logo boxes to open the Select Logo window. Select a logo from the list on the left and click Submit. The logo is placed in the corresponding location on the footer. Repeat this step for the other Select Logo box if desired.

Select Logo Window
-
Click the Cover Page tab.
-
To include an introductory page at the beginning of the PDF, select Include Cover Page. Deselect Include Cover Page to start the PDF with the chart report pages without an introductory page.

Cover Page Tab
-
If you select Include Cover Page, also complete the following steps:
-
To include a logo at the top of the cover page, select Include Logo. Then click Select Logoi n the Logo pane to open the Select Logo window. Select a logo from the list on the left and click Submit. Deselect Include Logo to leave the top of the cover page blank.
Select Logo Window
-
To determine whether the cover page should display in portrait or landscape mode, select the Portrait or Landscape option in the Orientation pane. This does not affect the orientation of the chart report pages.
-
If desired, enter your Company Name, Report Title, additional text, Date, and Job Number in the fields provided in the Cover Page Fields pane. Each entered value will appear as its own line on the cover page below the logo (if included) or at the top of the page (if the logo was not included).

Cover Page Fields
-
Click the Report Pages tab.

Report Pages Tab - General
-
Click General and select from the following options:
-
To determine whether the chart report page should display in portrait or landscape mode, select the Portrait or Landscape option in the Orientation pane. This does not affect the orientation of the cover pages.
-
To exclude maps, or either, select the No Map option.
-
To define whether maps of the geolocated records should be included in the report and, if so, where they should be located, select either Below Chart or Separate Page option.
-
Below Chart — on each page below the charts, plotting the geolocated records corresponding to the readings in the chart.
-
Separate Page — at the end of the report, plotting all geolocated records in the report.
-
-
To insert page breaks between segments identifying the sections of the surveyed area that do not have readings, select the Continuous Segments check box in the Other Options pane. Deselect the Continuous Segments check box to ignore breaks between survey segments.

Other Options for Report Pages
-
To place a label above each page's chart with the name of the file that the data originated from, select the Include Filenames check box Deselect the Include Filenames check box to not label each chart with the name of the file that the data originated from.
-
To include tick marks along the x-axis to identify each survey reading, select the Survey Ticks check box . Deselect the Survey Ticks check box to not insert tick marks along the x-axis for every survey reading.
-
To move the y-axis to the right side of the chart, select the Right Y-Axis check box. Deselect the Right Y-Axis check box to keep the y-axis on the left side of the chart.
-
To define whether comments should be included on the chart and, if so, where they should be located, in the Comments pane, select either None, On Chart, or Below Chart option.

Comments for Report Pages
If you select either On Chart or Below Chart, you can also select and define the following options:
-
To include GPS comments, select Include GPS.
-
To insert a GPS location comment at regular intervals along the x-axis, regardless of whether a reading exists at that location, select the GPS Intervals check box and enter a distance in feet in the field provided.
-
To set the color of the text for the comments, select the color box next to Comment Color to open the color definition window. Select a color from the list on the left, click in the color picker on the right, or enter a web-safe hex code in the field provided. Click Choose to define the comment color.

Comment Color Selection
-
-
Click the Chart & Map tab and complete the following steps:

Chart PDF Report - Report Pages: Chart & Map Tab
-
To allow each page's chart to scale vertically according to the individual chart's needs, in the Y-Axis Range pane, select the Autoscale Each Page option.
-
To scale every chart vertically according to a single, custom defined scale, select the Scale All Pages (Custom) option. Enter the lower and upper values for the y-axis in the Y1 and Y2 text fields, respectively.
-
To reset the Y2 and Y2 values, click Reset.
-
To define how often the vertical marks appear, enter a value in the Y-Axis Interval text field.
-
To define the range of values to display horizontally, enter a value in the X-Axis Range text field.
-
-
Click Submit. The report will generate. You will receive a notification to your associated email address when the report has been generated. Click the link in the email to open the report.