Flag Regions as Skips or Spikes
Regions of a survey can be set as a skip or flagged as either an on or off spike.
When survey data is modified![]() to refresh the survey and load the updated data in all of the panes.
to refresh the survey and load the updated data in all of the panes.
Set a Region as a Skip
Complete the following steps to set a region as a skip from the Chart pane:
-
Press Alt on the keyboard and click and drag to highlight the region to be skipped.
The Range Edit Options window opens.

Range Edit Options Window
-
Click Set As Skip from the Range Edit Options window. A confirmation window displays.

Add Skip Confirmation Window
-
Click Yes to confirm.
Flag Spikes
Complete the following steps to identify a region as a spike from the Chart pane either manually or automatically:
-
To manually flag a region as a spike, press Alt on the keyboard and click and drag to highlight the region to be flagged.
The Range Edit Options window opens.
Range Edit Options Window
-
Select Flag On Spike or Flag Off Spike from the Range Edit Options window. The Flag Spike window opens for either of these selections.

Flag Spike Window
-
Enter a new measurement value and reason in the fields provided.
-
Click Flag Spike. All data points within the selected region are updated with the new measurement value.

Survey Comments for a Spike
-
To automatically identify potential spikes or skips and manually correct the anomalous data, click
 to open the Flag Spikes Options window.
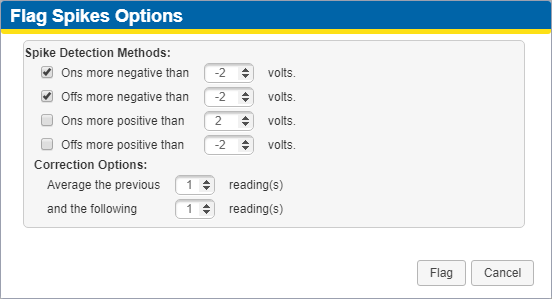
Flag Spikes Options Window
-
The Spike Detection Methods fields allow you to define the upper and lower boundaries that indicate potential anomalies when the boundaries are exceeded. Select the check box to detect on and/or off values that are more negative and/or more positive than a defined boundary and enter a value for that boundary in the associated text field.
-
In the Correction Options fields, determine how many readings before and after the current data point should be considered when PCS Survey Manager suggests a corrected value.
-
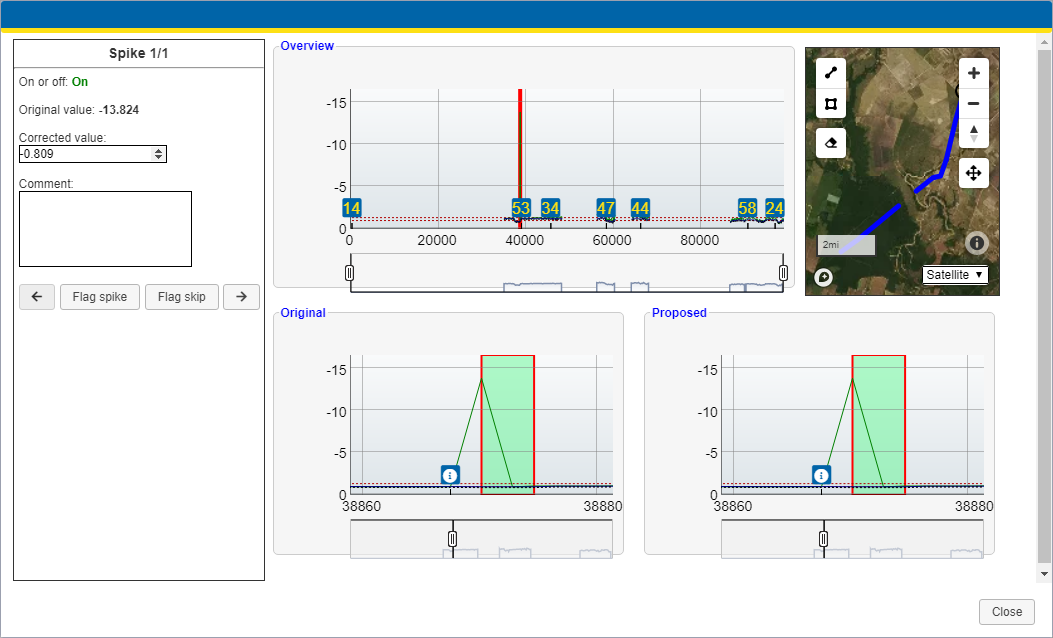
Click Flag to identify data points that exceed the boundaries defined. An overview window opens where you can review each of these data points.
Review
-
You can make each data point as either Flag spike or Flag skip:
-
Flag as a Spike — Review the value in the Corrected value field. The value entered in this field was created by taking an average of the values surrounding the data point. If desired, modify the Corrected value entry to reflect a value closer to the expected reading.
-
Flag as a Skip — Click Flag skip to mark the data point to be skipped.
-
-
Click
 or
or  to show the previous or next data point that exceeds the defined boundaries.
 -
Click Close to close the overview window.