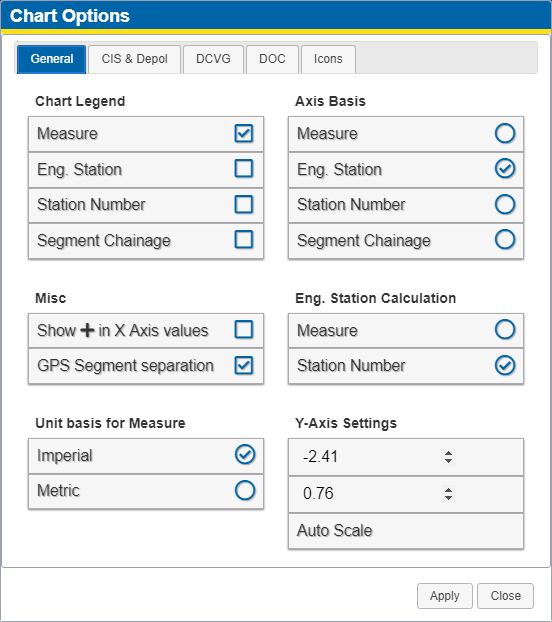
Chart Options — General Tab
Click the General tab to customize the chart options such as x-axis and y-axis settings, chart legend information, and whether to use Imperial or Metric units.

Chart Options - General Tab
-
In the Chart Legend section, select the check box next to the data you wish to display above the chart. When you hover over a data point on the chart, the legend at the top of the chart updates with information about the data point. The legend consists of On and Off values, as well as any of the following configurable options:
-
Measure: includes the (rounded) Measure value for the data point.
-
Eng. Station: based on the options chosen in Eng. Station Calculation section, either the (rounded) Eng. Station Measure value or Eng. Station Chainage value is included.
-
Station Number: includes the Station Number value for the data point.
-
Segment Chainage: includes the Segment Chainage value for the data point.
For more information about these fields and values, refer to Understanding Survey Distances.
-
-
In the Misc section, select the check box for how for the type of survey distance values to plot along the x-axis. The following options are available:
-
Show + in X Axis Values: The + symbol can be included in the display.
-
GPS Segment separation: The GPS distance will be added to the Station Number if the end of one segment and the start of the next segment are farther than the specified threshold.
-
-
In the Unit basis for Measurement section, select the radio button to use either Imperial or metric unit of measurement.
-
In the Axis Basis section, select the radio button for the type of survey distance values to plot along the x-axis. The following options are available:
-
Measure: includes the (rounded) Measure value for the data point.
-
Eng. Station: based on the options chosen in Eng. Station Calculation section, either the (rounded) Eng. Station Measure value or Eng. Station Chainage value is included.
-
Station Number: includes the Station Number value for the data point.
-
Segment Chainage includes the Segment Chainage value for the data point.
For more information about these fields and values, refer to Understanding Survey Distances.
-
-
In the Eng. Station Calculation section, select the radio button to use either Measure or Station Number option for this calculation.
-
In the Y-Axis settings section, select one of the following options to adjust the Y-axis scale:
-
Upper Limit: upper limit to the Y-axis.
-
Lower Limit: lower limit to the Y-axis.
-
Auto Scale: automatically scales the Y-axis settings.