View the DVM Graph
The DVM module can display the DVM readings in real-time as a waveform graph in the main DVM window.
When using the DVM module, tap the ![]() icon to view a waveform graph of the interruption cycle.
Tap the icon again to close the graph.
icon to view a waveform graph of the interruption cycle.
Tap the icon again to close the graph.
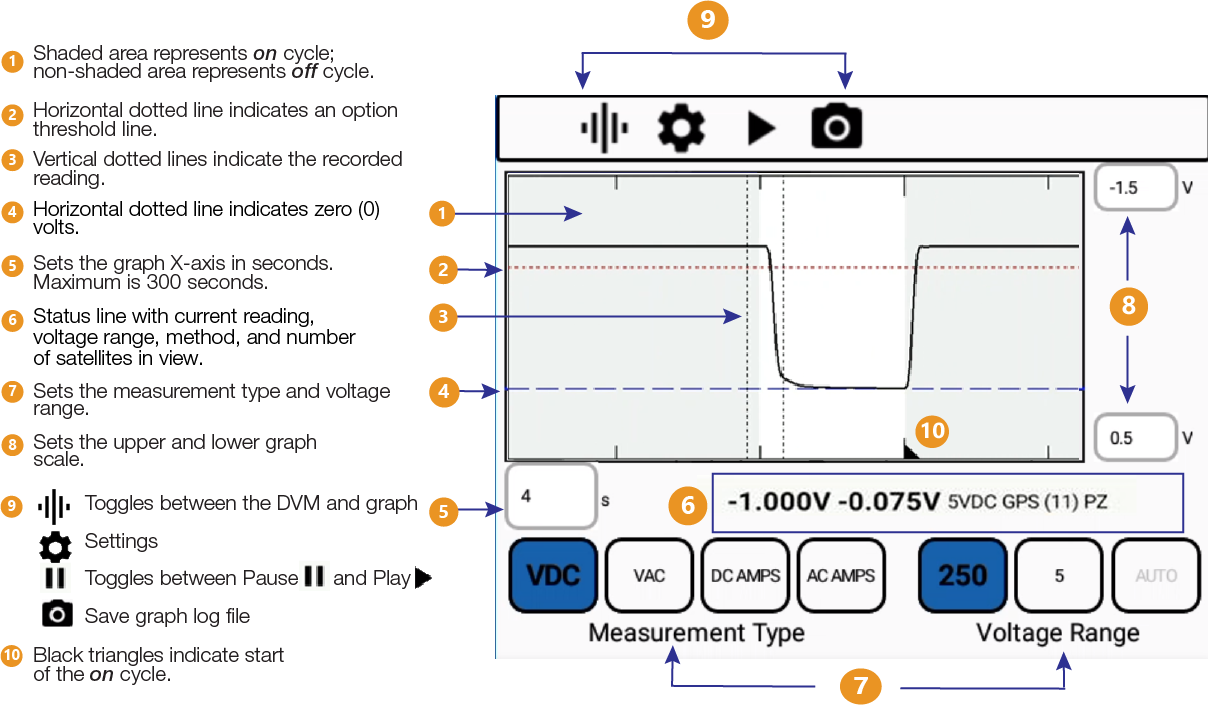
The following graphic identifies the areas of the graph.

DVM Graph and Points for GPS Sync
The graph includes a status line below the reading. The status line identifies the current reading, measurement type, and voltage range. If setup includes GPS Sync mode, the status line also identifies the number of satellites in view.
For example, a status line of 250VDC GPS (12) PZ indicates the following information:
-
250VDC: voltage range and test function
-
GPS: method includes GPS
-
(12): number of satellites in view
-
P: PPS time signal has been received
-
Z: ZDA message has been received
Other indicators that may appear in the status line include the following:
-
GPS (n): indicates GPS and the number of satellites in view
-
HiLo: indicates high/low readings
-
GPS (n HiLo): indicates GPS mode is selected but HiLo is used because the GPS signal is unavailable. The lowercase n represents the number of satellites in view.
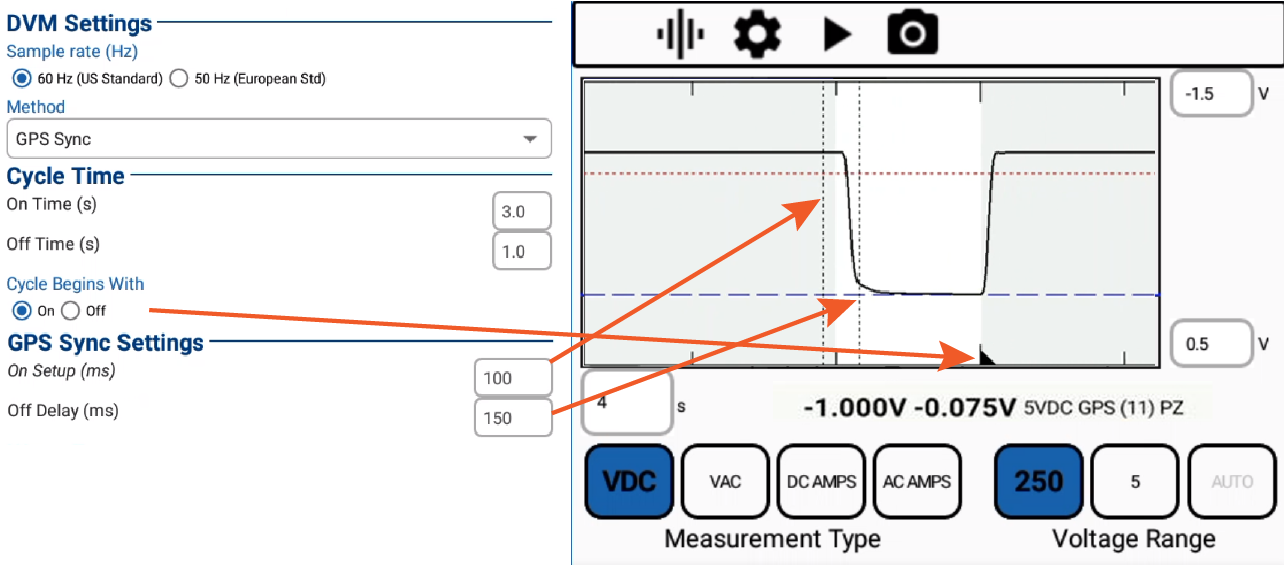
The following graphic identifies how the DVM settings are displayed in the graph and waveform.

DVM Settings for Graph and Waveform
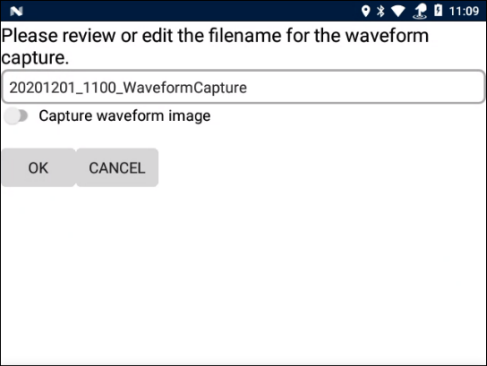
To save a log file and, optionally, capture a waveform image, tap the ![]() icon.
icon.
Give the waveform a name, select Capture waveform image option if desired, and tap OK.

Save Waveform