Summary Drilldown Report
The Summary report includes the Drilldown option for displaying data in an interactive pivot table format.
To view a Drilldown of the Summary report for a report that includes a Summary tab, click ![]() Drilldown in the <facility type> <report type> Report window. Examples of reports that include the Summary tab are Test Point Information Report and Test Point Inspection Report.
Drilldown in the <facility type> <report type> Report window. Examples of reports that include the Summary tab are Test Point Information Report and Test Point Inspection Report.
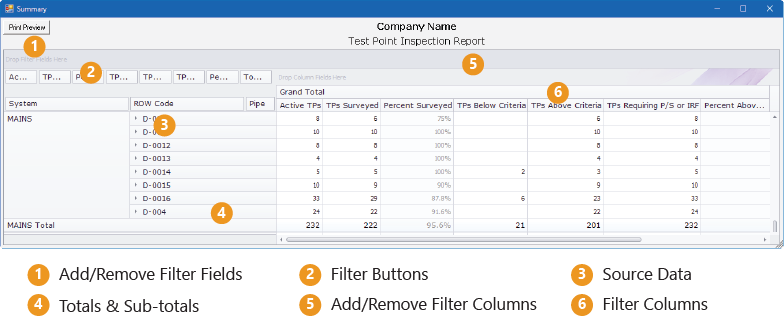
The following example is from the CPDM module and found through Reports/Graphs > Test Point Reports > Test Point Inspection Report > Summary > Drilldown.

Summary Drilldown Report
Drilldown allows you to display different representations of the same summary data. You can add, remove, and rearrange filters to display a subset of summary data for easier analysis of large amounts of data. Double-clicking a field opens a window with detailed drill-down information for the selected summation type. The following list describes operations you can perform in a pivot table:
-
Arrange Column Fields in the Grid — the arrangement of filter buttons corresponds to the arrangement of column fields in the grid. Drag a filter button to a different position within the group of buttons to rearrange column fields in the grid. Hover your mouse over a filter button to display a tool tip with the filter name.
-
Remove Column Fields in the Grid — drag a filter button to the area of the pivot table labeled Drop Column Fields Here to remove the selected column from the grid.
-
Remove Filters from Calculations — drag a filter button to the area of the pivot table labeled Drop Filter Fields Here to remove the selected filter from calculations.
-
View or print a section of the drilldown table — double-click a total or sub-total.