PCS Inspections Graph
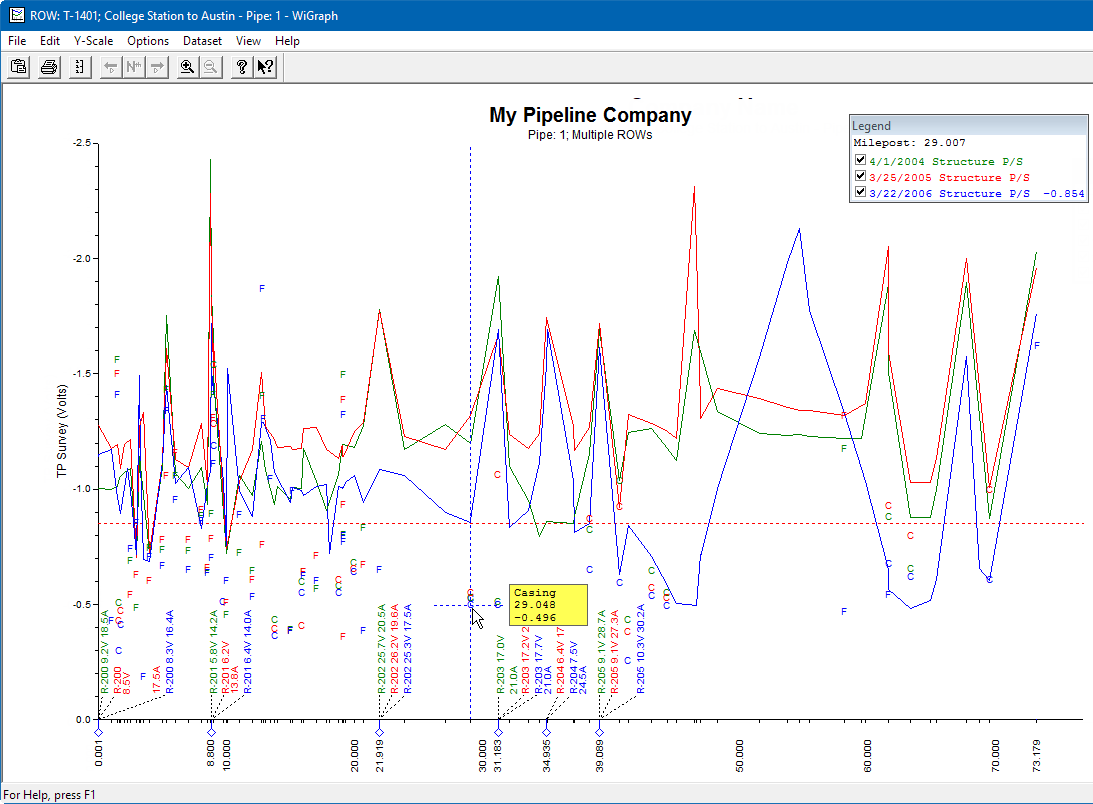
The PCS Inspections graph includes inspection readings in a facility survey or survey readings in a continuous survey based on property settings in the Graph tab. Property settings include selection of one or more band fields, survey folders, and graph options. Band fields are equivalent to data fields in a data entry grid, such as Structure P/S in the Edit CPDM Data grid and CIS Structure P/S in the Edit ISM Data grid.
Areas of the graph with spikes indicate areas where survey data should be reviewed closely. Locations in the graph marked with the letter C indicate Casing P/S. Those marked with the letter F indicate Foreign Bond. Hovering the mouse over either of these captions displays a yellow tooltip with measurement data as shown in the next example. To toggle these and other captions on or off when viewing the graph, click Options and then click a check box labeled with the caption you want to toggle on or off, such as Show Casing P/S.
To view the graph, click ![]() Graph in the PCS Inspections Graph window.
Graph in the PCS Inspections Graph window.

Example of PCS Inspections Graph