Set Graphing Parameters in a Graph Band
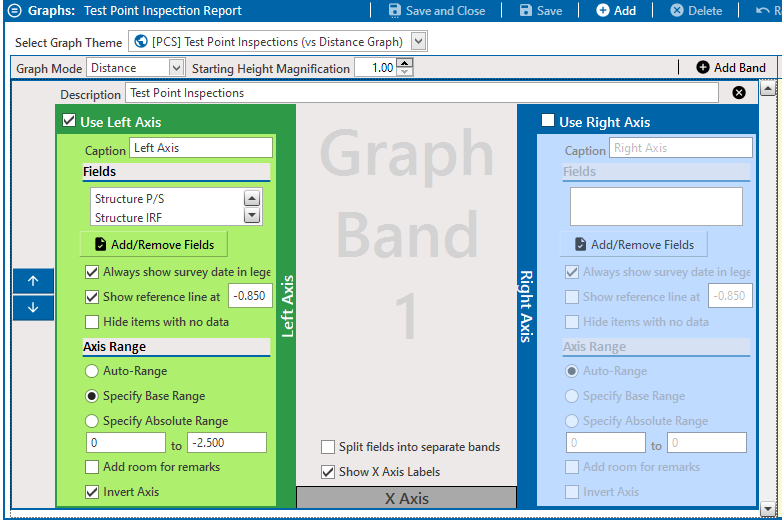
Each graph band consists of one chart with all of its band fields' data plotted. Data can be graphed on either the right or left axes or, if desired, both axes can be used to graph data. Click to select the Use Right Axis and/or Use Left Axis check box and set the following parameters for the selected axis or axes:

Use Left Axis and Use Right Axis Panes
-
Caption — enter new text in the Caption field to set a caption for the current axis.
-
Fields — click Add/Remove Fields. In the Edit Layout window, identify the fields that you want to add or remove from the graph band. Up to ten fields can be graphed on an axis at a time.
To add new fields, select the desired field(s) from the pane on the left and click
 . To remove existing fields, select the desired field(s) from the pane on the right and click
  . Once the correct fields are showing in the pane on the right, click OK.
 -
Modify Fields — you can further modify fields by selecting any of the following options:
-
Always show survey date check box: shows survey date.
-
Show reference line at check box: change the value, if necessary, in the text field provided.
-
Hide items with no data check box: do not show items that do not have data.
-
-
Modify the Data Fields Displayed — to further modify what data is plotted and how it is displayed, do any of the following:
-
To show the date of the survey alongside the survey data in the legend, select the Always show survey date in legend check box.
-
To plot only surveys that have data in the graph, select the Hide items with no data check box.
-
-
Axis Range — select the desired axis range. The following options are available:
-
Auto-Range: click the Auto-Range radio dial to have the axis range automatically determined based on the charted values.
-
Specify Base Range: click the Specify Base Range radio button and enter lower and upper values in the text fields provided below the range options. The axis range is determined by the values entered, unless the data plotted would exist out of the bounds of the lower and upper values entered. In this situation, the axis range would be extended to display all data points.
-
Specify Absolute Range: click the Specify Absolute Range radio button and enter lower and upper values in the text fields provided below the range options. The axis range is determined by the values entered. The axis range will not be extended, even if a data point plotted exists out of the bounds of the lower and upper values entered.
-
Add room for remarks check box: add space in the axis to accommodate remarks.
-
Invert Axis check box: the axis range and data plotted will be flipped vertically.
-