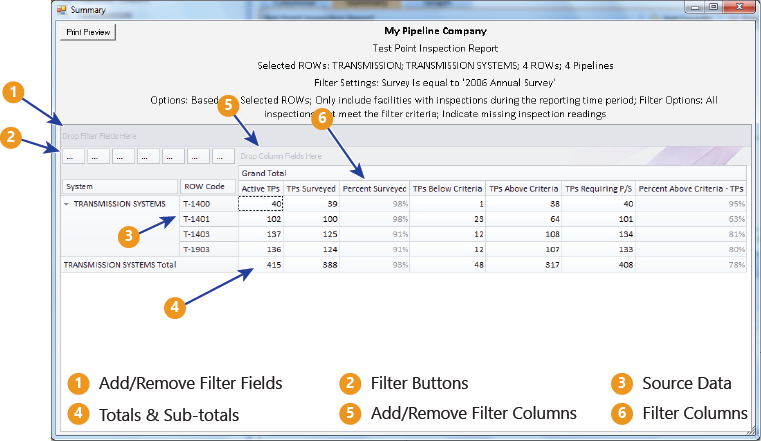
Arranging Column Fields in the Grid: The arrangement of filter buttons correspond to the arrangement of column fields in the grid. Dragging a filter button to a different position within the group of buttons subsequently rearranges column fields in the grid. Hovering the mouse over a filter button displays a tooltip with the filter name.
Removing Column Fields in the Grid: Dragging a filter button to the area of the pivot table labeled "Drop Column Fields Here" removes the selected column from the grid.
Removing Filters from Calculations: Dragging a filter button to the area of the pivot table labeled "Drop Filter Fields Here" removes the selected filter from calculations.
Double-click a total or sub-total to view or print details in a drilldown table.
