Bullhorn Integration Dashboard
The Bullhorn Integration Dashboard provides a comprehensive list of detected integration issues for mapped facilities, including warning messages for facility-specific issues.
Follow the steps below to access the Bullhorn Integration Dashboard.
-
Select Bullhorn Integration from the Tools menu, or click the Bullhorn Notification icon.
-
Click the Dashboard tab on the left side of the Bullhorn Integration window. If PCS detects integration issues for mapped facilities, the Dashboard tab displays a warning icon and a counter indicating the number of unresolved issues detected.
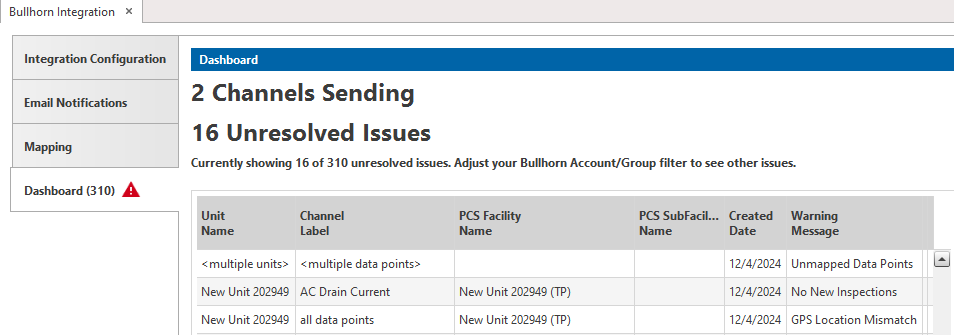
Dashboard
The number of unresolved issues displayed in the Dashboard window can be adjusted by changing the Bullhorn Account/Group filter under the Mapping tab. Refer to Working with Bullhorn Bridge Mapping Import Results for details.
-
To launch the Resolution Wizard, click on any data point for a desired facility or select the Resolve Issues option in the Dashboard menu bar.